


SUUNTOブログ


Over 50 events, 1 passion: Your guide to the 2025 UTMB World Series
The 2025 UTMB World Series is more exciting than ever with new destinations, the legendary challenges, and Suunto supporting athletes and fans alike.
The trail running world is set for another epic year as the 2025 UTMB World Series expands to over 50 events across 28 countries and five continents, bringing the spirit of adventure and community to runners everywhere.
As an official partner of the UTMB World Series, Suunto is proud to be on-site at most of these events, supporting athletes, showcasing our latest products, and inviting the community to join shake-out runs in the lead-up to race day. Whether you're toeing the start line, cheering from home, or meeting us at the expo, we’ll be there to share the journey.
From iconic landscapes to new territories, here’s what’s ahead in the 2025 season.
Eleven new events
The 2025 calendar introduces eleven exciting new races, expanding the series into new regions and offering runners even more ways to connect with the global trail scene. From windswept Cornish coastlines to the remote Chilean wilderness, these events bring fresh terrain and culture to the series.
Here’s the full list of new races joining the series:
Europe
Arc of Attrition (UK) – Jan 24–26Grand Raid Ventoux (France) – Apr 25–27Monte Rosa Walser Waeg (Italy) – Jul 18–20Kaçkar (Türkiye) – Sep 26–28Puglia (Italy) – Nov 7–9
Asia
Ultra-Trail Xiamen (China) – Mar 1–2Ultra-Trail Great Wall (China) – May 16–18Kaga Spa Trail Endurance 100 (Japan) – Jun 19–22
South America
Torrencial Chile – Jun 19–21Chihuahua (Mexico) – Oct 2–4Patagonia Bariloche (Argentina) – Nov 18–22
See the full 2025 UTMB World Series race calendar here.
Four majors, four chances to double your Stones
The UTMB World Series Majors are the pinnacle events of the season on each continent. These are the only races where athletes can double their Running Stones, increasing their chances of qualifying for the UTMB World Series Finals in Chamonix.
Running Stones are the official currency of the UTMB World Series qualification system. Runners earn them by finishing UTMB World Series races. The more Running Stones a runner collects, the more chances they have in the lottery to enter the UTMB World Series Finals in Chamonix.
In 2025, the Majors are:
Oceania Major: Ultra-Trail Australia – May 15–18
Europe Major: Val d'Aran – July 2–6
America Major: Kodiak Ultra Marathons – October 10–11
Asia–Pacific Major: Chiang Mai Thailand – December 5–8
All roads lead to the finals in Chamonix
The UTMB World Series season culminates in one extraordinary week in Chamonix, France, where the UTMB World Series Finals take place from August 25–31, 2025.
The three Finals are:
OCC (50K)
CCC (100K)
UTMB (100M)
Alongside these Finals, other events like the TDS, MCC, ETC, YCC, and the legendary PTL will fill the week with unforgettable moments, camaraderie, and trail running excellence.
Watch the season unfold live
Want to follow the drama as it happens? 12 races will be broadcast live in 2025 through UTMB Live. The UTMB Live season already started with the live streams of Chianti Ultra Trail and Tenerife Bluetrail in March.
Up-coming livestreamed races include:
Ultra-Trail Australia (Oceania Major)
Val D'Aran
Trail Verbier St-Bernard
Monte Rosa Walserwaeg
Eiger Ultra Trail
UTMB Mont Blanc (Finals)
Wildstrubel
Nice Côte d'Azur
Kodiak Ultra Marathons (America Major)
Chiang Mai Thailand (Asia–Pacific Major)
With coverage in multiple languages, drone footage, runner-mounted cams, expert commentary, live stats, and behind-the-scenes interviews, UTMB Live offers an immersive way to experience the races no matter where you are.
Even when races aren’t livestreamed, you can still follow the action in real time on live.utmb.world. The platform provides GPS tracking and real-time leaderboards optimized for mobile so you can check in from anywhere.
Suunto: Your partner on the trail
In 2025, we’ll be right there with you at most of the events – cheering you on at race expos, running side by side at shake-outs, and celebrating your finishes.
See you on the trails!
Read more
Pace your race with Abby, Iris and Dakota
Learn from your run with Hannes Namberger
Ultra running mantras: Mental fuel for the long haul

Suunto Vertical Week 2025 reached new heights!
The 11th annual Suunto Vertical Week was bigger than ever, bringing the community together for an epic challenge. Now, the results are in – see who climbed to the top!
From March 3–9, we challenged you to rack up as many vertical meters as possible. Once again, we set out to determine which nation and which activity type climbed the most. The data from the Suunto app is in – here are the results!
This year, you also had the chance to participate on Strava and support Protect Our Winters through the Vertical Week Strava Challenge. Our goal was to reach 1 million vertical meters, but you crushed that target – 121 times over!
We pledged to donate €1 for every 100 meters climbed to Protect Our Winters Europe, up to a limit of 1 million meters, to support their vital work in fighting climate change. Your passion exceeded all expectations – amazing!
Familiar names dominated the country rankings
In the country rankings for the average ascent per session, the usual suspects – nations in Europe’s mountainous regions – once again came out on top. Austria reclaimed the number one spot from Italy, while Switzerland held onto third place.
Average ascent per session by country
Austria – 399m
Italy – 392m
Switzerland – 373m
Slovenia – 346m
Slovakia – 305m
Spain – 273m
France – 271m
Germany – 230m
Czech Republic – 221m
Croatia – 214m
When looking at total ascent from all participants, France secured the top spot, followed by Spain and Italy.
Total ascent by country
France
Spain
Italy
Germany
Austria
Switzerland
Poland
USA
Slovenia
United Kingdom
On an individual level, ten participants climbed over 14,000 meters in a week – averaging more than 2,000 meters per day. Well done!
To make the top 10%, you needed to climb 2,200 meters – 75 meters less than last year but still 300 meters more than in 2023.
For the top 3%, the benchmark was 3,958 meters – 104 meters less than last year but 368 meters more than two years ago.
Ski tourers lead the way
As in previous years, ski tourers dominated. Ski touring was the only activity type where the top three countries averaged over 1,000 meters per session. The overall ski touring average was an impressive 947 meters.
However, when looking at the total number of big '1000-meter days', trail runners recorded the most this time.
The only country with more than one win in the activity type rankings was South Africa: They dominated both the mountain biking and cycling rankings. Congrats!
Ski touring
Austria – 1,044m
Switzerland – 1,036m
France – 1,005m
(All ski touring activities average per session: 947m)
Austria claimed the top spot, dethroning Slovakia, while France moved up to third. The 1000-meter mark remains a clear goal for skiers, with the entire top three surpassing it once again. Germany and Italy followed closely at 987 and 971 meters, respectively.
Mountaineering
France – 968m
Austria – 761m
Italy – 750m
(All mountaineering activities average per session: 633m)
France took a strong category win in mountaineering, with the average ascent for all mountaineering activities remaining exactly the same as last year! (Edit: The top 3 was corrected on March 14 due to an error on our dashboard.)
Trail running
Japan – 805m
Italy – 652m
Portugal – 592m
(All trail running activities average per session: 444m)
Japan continued to lead, though their average was lower than last year – perhaps due to deep powpow this winter?
Mountain biking
South Africa – 490m
Spain – 346m
Slovenia – 297m
(All moutain biking activities average per session: 368m)
South Africa maintained its top position despite a drop in its average from 645m to 490m. Is the country getting ready for the upcoming Cape Epic or what do these strong performances in the MTB rankings tell?
Gravel cycling
Czech Republic – 524m
Switzerland – 505m
Spain – 422m
(All gravel cycling activities average per session: 289m)
A full reshuffling – last year’s top three didn’t return to the podium this year! Is this a sign of gravel cycling still evolving and growing as a sport?
Cycling
South Africa – 490m
Spain – 346m
Slovenia – 297m
(All cycling activities average per session: 172m)
Spain and Slovenia held their ranks, but South Africa stole the show with another category win. Lekker, bru!
Trekking
Spain – 628m
Slovenia – 379m
Italy – 340m
(All trekking activities average per session: 334m)
Trekking had a fresh top 3 with Spain clearly taking the win.
Hiking
Slovenia – 555m
Portugal – 529m
Spain – 496m
(All hiking activities average per session: 235m)
Slovenia delivered strong performances across multiple categories this year: number one in hiking but also top three in mountain biking, cycling, and trekking. Kapo dol!
Cross-country skiing
Italy – 340m
Czech Republic – 325m
France – 322m
(All XC skiing activities average per session: 227m)
Unlike other activities, cross-country skiing was the only one where the average ascent increased from last year.
Running
Norway – 123m
Switzerland – 122m
Belgium – 119m
(All running activities average per session: 82m)
This was the closest battle of all, with Norway edging out Switzerland by just half a meter! The average ascents in Suunto’s most popular activity type, running, are not huge but that makes the battles even more exciting!
See you next year!
Vertical Week 2025 proved once again that the Suunto community is unstoppable. Whether you were ski touring in the Alps, trail running in Japan, or cycling in South Africa, your dedication made this event one for the record books.
See you next year – until then, keep climbing!

Chianti Ultra Trail by UTMB
The trail running season is finally starting again! The first unmissable event is the Chianti Ultra Trail by UTMB, taking place from March 20 to 23.
The 2024 edition was a record-breaker, with over 3,600 participants from 72 nations and more than 10,000 visitors over the three thrilling days of races.
© Jose Miguel Munoze
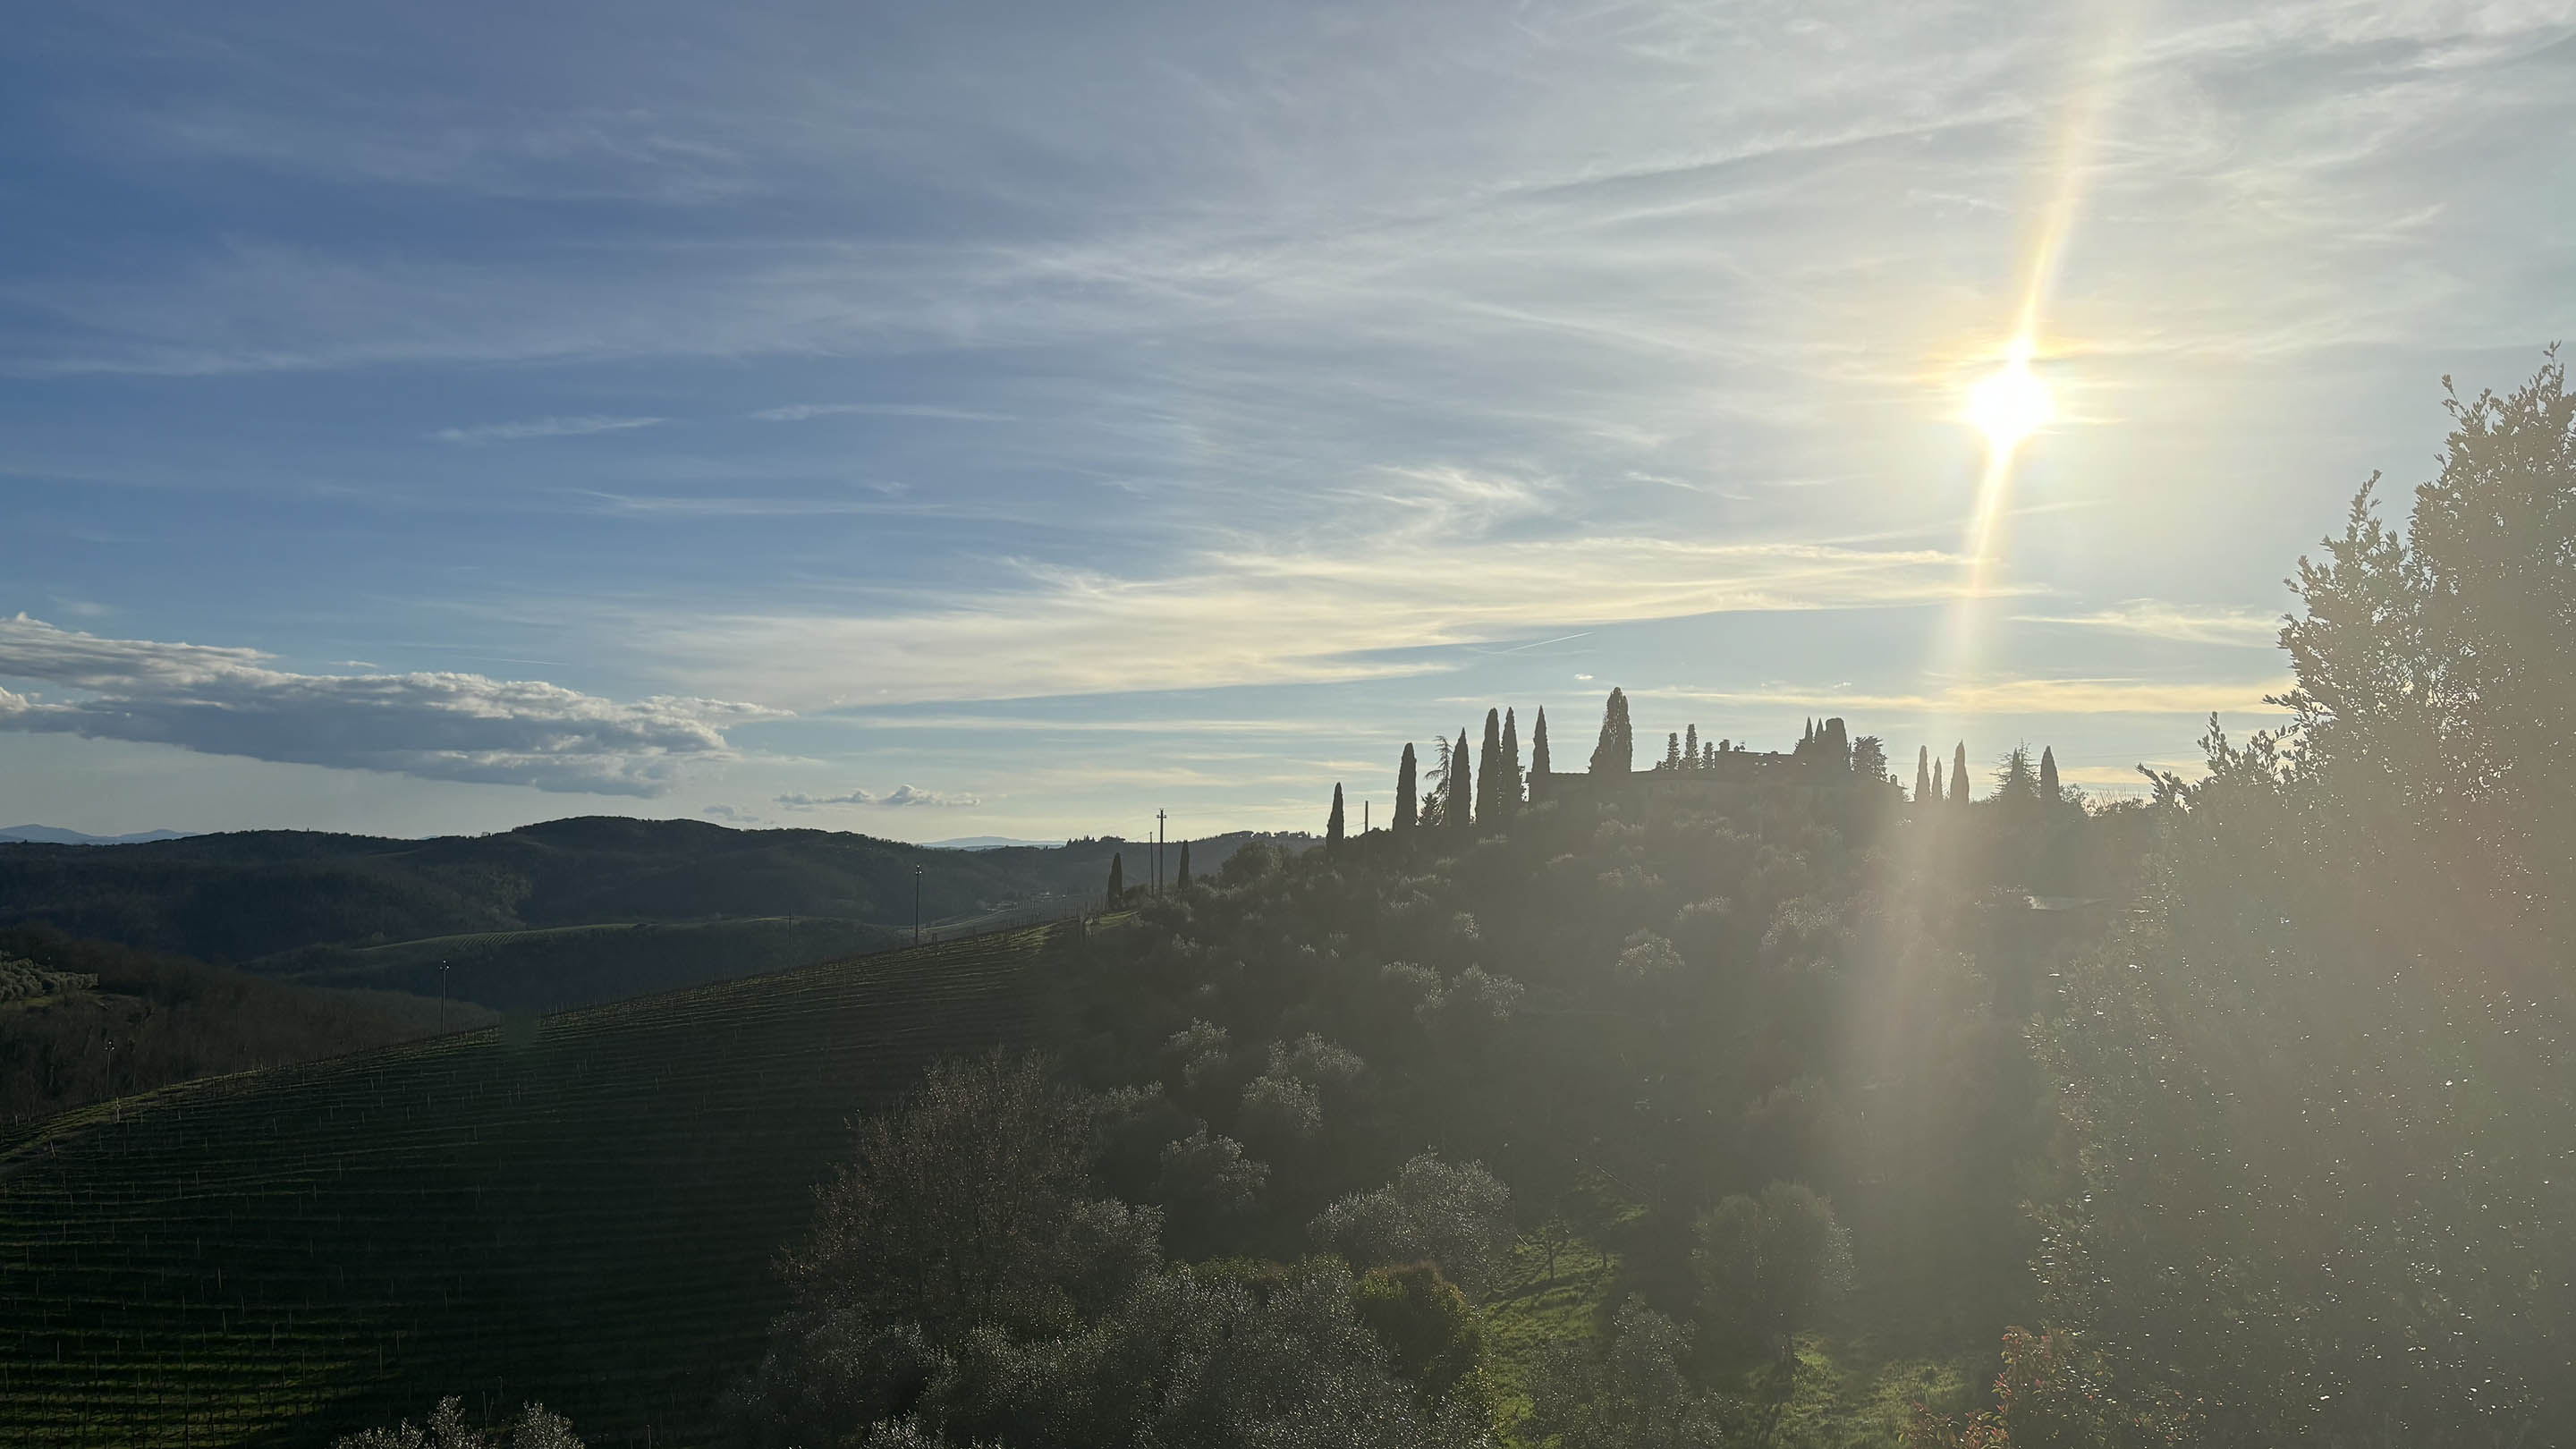
What makes this event truly special is its unique setting: the Chianti hills — candidates to become a UNESCO heritage site — renowned for their stunning natural beauty, medieval villages, vineyards, and forests.
The races unfold amidst this breathtaking landscape, once again attracting athletes from around the world.
Our Suunto athletes are ready to give it their all, including Italians Andreas Reiterer — last year’s winner of the most challenging race, the Ultra Trail Chianti Castles (120 km and +5200 m of pure passion and talent) — alongside Davide Cheraz and Mattia Bertoncini. Also competing are Ugo Ferrari and Alban Berson (FR), Dominika Stelmach (POL), Tomas Farnik (Czech Republic), and Abby Hall and Ryan Montgomery (USA).
Suunto will be at the event village with a booth, where our team will be happy to share the latest brand news and showcase our products.
But that's not all — join the COMMUNITY RUN in collaboration with Näak! Experience the thrill of running 5 km through the Chianti hills and enjoy a snack at the end of your workout.
Community Run Program — Saturday, March 22
14:30: Departure from the Suunto booth
5 km route through the Chianti hills
15:30 (approx.): Arrival at the Näak booth
Post-run snack with Näak products and soft drinks
Register now and don’t miss this unique opportunity to test one of our sports watches during the run!
Sign up

Suunto partners with the UTMB World Series
Sharing the same passion for sports and the outdoors, UTMB® World Series and Suunto, known for their world-renowned GPS multisport watches and training tools, have announced a global partnership, that will see the two companies work together to contribute to the positive development of trail running and help individual runners reach their goals.
Suunto have supported adventurers since 1936 and have been involved in trail running since its inception. Their legacy in the sport is enriched by a strong team of elite runners, including UTMB Mont Blanc winners Courtney Dauwalter, Francois D’Haene and Pau Capell. Suunto watches feature award-winning design, industry-leading battery life, reliability, and purpose-built features for training and racing.
As Official GPS Watch and Technical Partner of the UTMB World Series, Suunto will support runners in navigating the trails and achieving their dreams across the 41 UTMB World Series Events, by bringing its heritage and experience with GPS sports watches. Athletes with a Suunto Vertical or Suunto Race watch can download intuitive GPS maps in three different map styles with important landmarks, contour lines, water, paths and different sorts of terrain highlighted. Maps are available for each UTMB World Series Event, whether you are running the 100K CCC® (Courmayeur-Champex-Chamonix) in the European Alps, the 50K Kodiak Ultra Marathons by UTMB in California, the 100M Black River Peak race in the sugarcane fields for Mauritius by UTMB... or any other race of the circuit.
Frédéric Lénart, UTMB Group CEO, said:
“We are delighted to join forces with Suunto who has over 80 years’ experience in creating products that runners can rely on in the most extreme conditions. With Suunto becoming Technical Partner of the UTMB World Series, we will enable runners to live adventure that stays with them forever, helping them to take the first step and keep on moving.”
Hannu Korpivaara, Suunto Brand and Marketing Director, said:
“We firmly believe that collaboration empowers companies, communities, and individuals to evolve. It fosters relationship-building, innovation, and effective problem-solving. We are honored to partner with the UTMB World Series and to connect with all the runners out there. Together, we aim to contribute to the positive development of trail running and help individual runners reach their goals.”
The 2024 UTMB World Series kicks off this month with the Tarawera Ultra-Trail New Zealand by UTMB from the 17-18 February. This inaugural event of the year welcomes trail runners of all abilities and promises unforgettable moments in the most stunning scenery of Rotorua.
About UTMB® World Series
UTMB® World Series is the world’s ultimate trail-running circuit that unites the sport’s biggest stars and passionate runners through the best, leading international events in the most stunning locations. Built on a passion for the mountains with sustainability at its heart, UTMB® World Series gives all trail runners the chance to experience the UTMB® adventure across the world, with events taking place across Asia, Oceania, Europe, Africa, and the Americas. It is the only place where runners can begin their quest to Dacia UTMB® Mont-Blanc, France, where the prestigious UTMB® World Series Finals will be held. Launched in May 2021 through the collaboration between the UTMB Group and The IRONMAN Group, the UTMB World Series circuit brings together many of the best international trail-running events on the planet.
For more information, visit https://utmb.world/.
About UTMB Group
Since the creation of Dacia UTMB® Mont-Blanc in 2003 by a group of passionate friends, UTMB Group has been the driving force behind the development of trail running. The Dacia UTMB® Mont-Blanc is the sports pinnacle event, and every year, 10,000 runners earn their place on the start line. UTMB Group also pioneered the LiveTrail® technology, an innovative digital service that supports the management of endurance races. Revered by hundreds of thousands of athletes, UTMB® has become a global, premium, and leading brand. In May 2021, UTMB Group partnered with The IRONMAN Group to launch the UTMB® World Series, now in its second year, which brings together many of the best international events on the planet to provide exclusive access to the sport’s pinnacle event, Dacia UTMB® Mont-Blanc. The UTMB® World Series is built on the founding principles of Dacia UTMB® Mont-Blanc: surpassing oneself; fair-play; respect for people and the environment; and solidarity.
Find out more at https://utmb.world/.
About Suunto
We stand for adventure. Pioneering has been in our DNA since 1936, when Finnish orienteer Tuomas Vohlonen invented a more accurate and reliable compass. Today, Suunto is at the forefront of design and innovation for sports watches, dive computers, compasses and digital services used by adventurers and athletes around the world.
Since 2022 we have conducted cradle to grave Life Cycle Assessments (LCA) for our new watch models to understand their environmental impact and to help us improve our ways of working. The remaining emissions we offset with Verified Carbon Units.
We pride ourselves on the fact that Suunto products are not only robust, but also have an everyday aesthetic that reflects our Nordic identity. Suunto's headquarters and own factory are located in Vantaa, Finland.
Find out more at apac.suunto.com


Getting started with ZoneSense: Your guide to smarter training
Have you tried Suunto ZoneSense yet? This article will help you get started with the breakthrough innovation in tracking real-time exercise intensity.
In endurance training, finding the right workout intensity is key to getting the best results. Many athletes wonder if they’re training too hard or not hard enough. Heart rate zones have been used to estimate intensity, but they don’t account for changes from one day to another, across different activity types or during long workouts.
Now, Suunto ZoneSense offers a breakthrough in tracking real-time intensity. It uses heart rate variability (HRV) to give accurate insights, helping athletes optimize their performance like never before.
All Suunto users training with a heart rate belt can unlock ZoneSense intensity analysis through the Suunto app. For real-time data, ZoneSense is available on the latest Suunto watches – Suunto Vertical, Suunto Race, Suunto Race S, Suunto Ocean, and Suunto 9 Peak Pro.
Step 1: Learn how to get started with Suunto ZoneSense. All you need is a Suunto sports watch, a Suunto heart rate belt and the Suunto app on your phone.
Step 2: Learn how to use Suunto ZoneSense in real-time, during an activity.
A great way to get started is by following ZoneSense during a long, easy endurance workout. Begin with a 10-minute warm-up that allows ZoneSense to establish your baseline for the day, then keep your effort in the green zone.
Step 3: Learn how to view Suunto ZoneSense data in the Suunto app.
Suunto ZoneSense lets athletes take control of their training like never before. It uses heart rate variability (HRV) to show whether your workout effort is aerobic (low stress) or anaerobic (high stress) in real time. With ZoneSense, you can fine-tune your intensity during any activity—running, cycling, swimming, and even team sports—helping you make every session count. Say goodbye to guessing your effort level and hello to smarter, more effective training.
Whether you’re building your aerobic base or pushing your limits with high-intensity intervals, ZoneSense is the key to unlocking your potential. It keeps your long runs in the optimal green zone, shows when you’ve hit your anaerobic threshold during intervals, and adapts seamlessly across different sports and conditions. By tracking real-world effort and avoiding overtraining, Suunto ZoneSense sets a new standard for athletes aiming to train with precision and perform at their best.
Learn more about Suunto ZoneSense use cases here.


登山・ハイキングの安全対策|迷ったときに取るべき行動と出発前の準備
登山やハイキング、トレイルランニングは、自然の中で過ごす楽しさを感じられるアクティビティです。
一方で、山や森、初めて歩くトレイルでは、分岐の見落とし、天候の変化、日没、疲労、スマートフォンの電池切れなどによって、道に迷うリスクがあります。
道に迷わないためには、ナビゲーションスキルだけでなく、出発前の準備、装備、行動計画の共有、そして迷ったときにどう行動するかを知っておくことが大切です。
この記事では、登山やハイキング、トレイルランニングをより安心して楽しむための安全対策と、迷ったときに取るべき行動を紹介します。
目次
アウトドアで道に迷うリスクは誰にでもある
出発前にできる安全対策
迷ったときに取るべき行動
Suuntoウォッチでできる安全対策
ナビゲーションスキルを詳しく学びたい方へ
まとめ|安全対策は、出発前の準備と迷ったときの判断から
アウトドアで道に迷うリスクは誰にでもある
道迷いは、初心者だけに起こるものではありません。
経験のある登山者やトレイルランナーでも、視界が悪い日、疲労が強いとき、初めて歩くルート、標識が少ない場所では、現在地や進行方向を見失うことがあります。
特に注意したいのは、次のような場面です。
分岐が多いルート
似た景色が続く森や低山
霧、雨、雪で視界が悪いとき
日没が近い時間帯
疲労で判断力が落ちているとき
スマートフォンの電波が届かない場所
バッテリー残量が少ないとき
地図やルートを事前に確認していないとき
アウトドアでは、「自分は大丈夫」と思い込まないことが大切です。
迷わないための準備と、迷ったときの行動を知っておくことが、安全につながります。
出発前にできる安全対策
道迷いを防ぐために最も大切なのは、出発前の準備です。
現地に着いてから考えるのではなく、出発前に天気、ルート、装備、連絡手段を確認しておきましょう。
1. 天気を確認する
登山やハイキングでは、天気の確認が安全対策の基本です。
晴れているように見えても、山では急に霧が出たり、雨が降ったり、気温が下がったりすることがあります。天候が悪化すると、視界が悪くなり、分岐や標識を見落としやすくなります。
出発前には、目的地周辺の天気、気温、風、降水確率、日没時刻を確認しましょう。標高差のあるルートでは、登山口と山頂付近で気温や風の状況が大きく変わることもあります。
確認したいポイント
気温
降水確率
風の強さ
雷の可能性
日の入り時刻
ルート上の標高差
雨や霧で視界が悪くなる可能性
天気が不安定な日は、ルートを短くする、標高の低い場所に変更する、出発時間を早める、中止するなどの判断も大切です。
▶︎関連記事:登山やトレイルで天気を確認する方法|Suuntoウォッチで気圧・日没・ストームアラームを活用
2. ルートと帰着予定時刻を決める
出発前に、歩くルートと帰着予定時刻を決めておきましょう。
目的地だけを決めるのではなく、どの登山口から入り、どのルートを通り、どこで休憩し、何時ごろ下山するのかを考えておくことが大切です。
特に初めてのルートでは、距離だけでなく、標高差、コースタイム、分岐、エスケープルート、水場、日没時刻を確認しておきましょう。
事前に確認したいこと
ルートの距離
標高差
コースタイム
分岐の場所
エスケープルート
水場や補給できる場所
下山予定時刻
日没時刻
電波が入りにくい場所
登山やトレイルランニングでは、距離だけではルートの難しさを判断できません。同じ10kmでも、平坦な道と標高差の大きい山道では、必要な体力や時間が大きく変わります。
ルート上の登り下りを把握したい方は、こちらの記事も参考にしてください。
▶︎関連記事:登山・トレイルで登り下りを把握する重要性|Suuntoクライムガイダンスで地形を先読み
3. 行動計画を家族や友人に共有する
出発前には、行動計画を家族や友人に共有しておきましょう。
どこに行くのか、どのルートを歩くのか、何時ごろ戻る予定なのかを伝えておくことで、万が一予定時刻を過ぎても戻らない場合に、周囲が異変に気づきやすくなります。
グループで行動する場合は、メンバー全員が同じルートを把握していることも大切です。一部の人だけがルートを知っている状態では、はぐれたときや予定変更が必要になったときに対応しにくくなります。
共有しておきたい情報
行き先
出発予定時刻
帰着予定時刻
使用する登山口
予定ルート
同行者の人数
車を停める場所
緊急時の連絡先
Suuntoアプリで作成したルートや、GPXファイルを使ったルートをウォッチに同期しておくと、グループ内でルートを共有しやすくなります。
▶︎関連記事:GPXルートをSuuntoウォッチに追加する方法|ルートプランナーを使った設定手順
4. 必要な装備を持つ
短いハイキングでも、最低限の装備は持って行きましょう。
天気が変わったとき、予定より行動時間が長くなったとき、道に迷ったときに、装備の有無が大きな差になります。
持っておきたい装備
レインウェア
防寒着
ヘッドライト
予備バッテリー
水
行動食
ファーストエイドキット
ホイッスル
地図
コンパス
スマートフォン
モバイルバッテリー
緊急連絡手段
明るい色のウェアや小物
ヘッドライトは、日帰り登山でも持っておきたい装備です。予定より下山が遅れた場合や、日没が早まる季節には特に重要です。
また、ホイッスルやライトは、見つけてもらいやすくするためにも役立ちます。声を出し続けるよりも、ホイッスルの方が少ない体力で遠くに音を届けやすい場合があります。
5. 地図・コンパス・GPSを複数の手段として準備する
スマートフォンやGPSウォッチは、現在地やルートを確認するうえで便利なツールです。
一方で、バッテリー切れ、電波の届かない場所、端末の故障、雨や寒さによる操作性低下なども考えられます。アウトドアでは、ひとつの手段だけに頼らず、複数の手段を準備しておくことが大切です。
準備しておきたい確認手段
紙の地図
コンパス
スマートフォンの地図アプリ
GPSウォッチ
事前に保存したルート
オフラインマップ
GPXルート
GPSウォッチやスマートフォンは便利ですが、地図とコンパスの基本を理解しておくことで、テクノロジーが使えない状況でも判断しやすくなります。地図の読み方やコンパスの使い方を詳しく知りたい方は、こちらの記事をご覧ください。
▶︎関連記事:登山で道迷いを防ぐには?地図・コンパス・GPSウォッチを使ったナビゲーションの基本
迷ったときに取るべき行動
どれだけ準備していても、想定外の状況は起こることがあります。
道に迷ったと感じたときに大切なのは、焦って進み続けないことです。パニックになって無理に歩き回ると、現在地がさらにわからなくなり、体力も消耗してしまいます。
ここからは、迷ったときに取るべき行動を紹介します。
落ち着いて止まる
道に迷ったかもしれないと感じたら、まず止まりましょう。
「もう少し進めばわかるかもしれない」と思って歩き続けると、確実にわかる場所からどんどん離れてしまうことがあります。
まずは深呼吸をして、最後に確実に現在地を把握できていた場所を思い出します。分岐、標識、橋、沢、尾根、ベンチ、建物など、通過した目印を確認しましょう。
最初にすること
その場で止まる
深呼吸して落ち着く
最後に確実にいた場所を思い出す
地図やGPSで現在地を確認する
むやみに下らない
焦って近道を探さない
山では、「下ればどこかに出る」と考えるのは危険な場合があります。沢や急斜面に入り込むと、かえって状況が悪くなることがあります。
現在地を確認する
落ち着いたら、現在地を確認します。
地図、コンパス、GPSウォッチ、スマートフォンの地図アプリを使い、周囲の地形や目印と照らし合わせましょう。
確認したい情報
最後に通過した分岐
近くの標識や看板
尾根や谷の方向
川や沢の位置
登っているのか、下っているのか
予定ルートから外れていないか
スマートフォンやウォッチ上の現在地
戻れる自信がある場合は、最後に確実にいた場所まで戻ることも選択肢です。ただし、視界が悪い、日没が近い、体力が少ない、ルートが不明確な場合は、無理に動かない判断も必要です。
無理に進まない
現在地がわからないまま、勘で進み続けるのは避けましょう。
山や森では、少し進んだだけでもルートから大きく外れることがあります。疲れているときや暗くなり始めているときは、判断力も落ちやすくなります。
特に、次のような行動は避けたいところです。
沢に向かって下る
道ではない斜面を進む
近道だと思ってルートを外れる
暗くなってから無理に歩く
体力が少ない状態で移動し続ける
安全に戻れる確信がない場合は、その場で状況を整理し、連絡できる場合は助けを求める準備をしましょう。
連絡できる場合は助けを求める
スマートフォンの電波がある場合は、早めに助けを求めましょう。
家族や同行者、山小屋、緊急連絡先、必要に応じて警察や消防へ連絡し、自分の状況を伝えます。
連絡するときは、できるだけ具体的な情報を伝えることが大切です。
伝えたい情報
現在地
予定していたルート
登山口
最後に通過した地点
人数
体調
ケガの有無
装備
水や食料の残り
バッテリー残量
周囲に見える目印
日没までの時間
電波が弱い場合は、位置情報や短いメッセージを送るだけでも役立つことがあります。バッテリーを消耗しすぎないよう、不要な操作は控えましょう。
見つけてもらいやすくする
助けを待つ場合は、見つけてもらいやすくする工夫をしましょう。
動き回るよりも、見通しのよい安全な場所で待つ方が、発見されやすい場合があります。
見つけてもらうための工夫
明るい色のウェアや小物を見える位置に出す
ホイッスルを定期的に鳴らす
ライトを使う
開けた場所に移動する
目立つ場所に留まる
スマートフォンのバッテリーを温存する
夜間はライトを必要なときだけ使う
ホイッスルやライトは、体力をあまり使わずに存在を知らせるために役立ちます。声を出し続けると体力を消耗しやすいため、無理をしないことも大切です。
体温と体力を守る
迷ったときは、体温と体力を守ることが重要です。
雨、風、低温、汗冷えは、体力を奪います。特に山では、日が落ちると気温が急に下がることがあります。
体温と体力を守るポイント
レインウェアや防寒着を着る
風を避ける
濡れた服をそのままにしない
地面に直接座らない
行動食を少しずつ食べる
水分を少しずつとる
無駄に歩き回らない
体力を温存する
体力を使い切ってから助けを待つよりも、早めに止まり、体温とエネルギーを守る方が安全につながります。
Suuntoウォッチでできる安全対策
対応するSuuntoウォッチは、登山、ハイキング、トレイルランニングでの行動をサポートします。
ただし、GPSウォッチは安全を保証するものではありません。地図、コンパス、天気確認、装備、判断力と組み合わせて使うことが大切です。
山やハイキング向けのGPSウォッチの選び方は、こちらの記事で詳しく紹介しています。
▶︎関連記事:登山用GPSウォッチの選び方|ハイキング・トレイルで役立つ機能を解説
ルートナビゲーション
対応するSuuntoウォッチでは、事前に作成したルートを同期し、ウォッチ上でルートナビゲーションを使うことができます。
ルートを準備しておくと、分岐や現在地を確認しやすくなり、予定ルートから外れたときにも気づきやすくなります。
オフラインマップ
オフラインマップ対応モデルでは、スマートフォンの電波が届きにくい場所でも、事前にダウンロードした地図をウォッチ上で確認できます。
山やトレイルでは、電波が入らない場所もあります。事前にマップを準備しておくことで、現在地や周囲の地形を確認しやすくなります。
トラックバック
対応するSuuntoウォッチでは、トラックバック機能を使って、出発地点へ戻る方向を確認できます。
来た道を完全にたどるための万能機能ではありませんが、スタート地点へ戻る方向を把握するための補助として役立ちます。
GPXルートの活用
GPXファイルを使ってルートを追加すれば、事前に計画したルートをウォッチで確認しながら行動できます。
初めて歩くルート、分岐の多いトレイル、トレイルランニングのレースコースなどでは、事前にルートを準備しておくと安心です。
▶︎関連記事:GPXルートをSuuntoウォッチに追加する方法|ルートプランナーを使った設定手順
天気・日没の確認
対応するSuuntoウォッチでは、気圧傾向、ストームアラーム、日の出・日の入り時刻などを確認できます。
日没時刻や天候の変化を把握しておくことで、下山時間やルート変更の判断がしやすくなります。
▶︎関連記事:登山やトレイルで天気を確認する方法|Suuntoウォッチで気圧・日没・ストームアラームを活用
ナビゲーションスキルを詳しく学びたい方へ
この記事では、出発前の準備、迷ったときの行動、Suuntoウォッチを使った安全対策を紹介しました。
地図の読み方、コンパスの使い方、地形図や等高線の見方など、ナビゲーションの基本を詳しく知りたい方は、こちらの記事をご覧ください。
▶︎関連記事:登山で道迷いを防ぐには?地図・コンパス・GPSウォッチを使ったナビゲーションの基本
まとめ|安全対策は、出発前の準備と迷ったときの判断から
登山、ハイキング、トレイルランニングでは、自然の中で過ごす楽しさがある一方で、道迷い、天候変化、日没、疲労などのリスクがあります。
安全にアウトドアを楽しむためには、出発前の準備が大切です。
天気を確認する
ルートと帰着予定時刻を決める
行動計画を家族や友人に共有する
必要な装備を持つ
地図、コンパス、GPSなど複数の確認手段を準備する
そして、迷ったときは、焦って進み続けないことが重要です。
落ち着いて止まる
現在地を確認する
無理に進まない
連絡できる場合は助けを求める
見つけてもらいやすくする
体温と体力を守る
対応するSuuntoウォッチのルートナビゲーション、オフラインマップ、トラックバック、天気・日没確認は、アウトドアでの行動判断をサポートします
ただし、ウォッチやスマートフォンだけに頼らず、事前準備、装備、基本的なナビゲーションスキルと組み合わせて活用することが大切です。
安全対策を整えて、自然の中で過ごす時間をもっと安心して楽しみましょう。
▶︎登山・トレイルに対応したSuunto GPSスマートウォッチを見る


