


坂道を含むコースでは、同じペースで走ろうとしても上りで苦しくなり、下りでは楽に感じることがあります。平均ペースだけを見ていると、その日の運動強度やトレーニング負荷を正しく捉えにくいこともあります。
そこで役立つのが、TrainingPeaksのランニング指標である「rTSS」「NGP」「IF」です。3つの数値はそれぞれ、トレーニング全体の負荷、勾配を考慮したペース、閾値に対する相対的な強度を示します。
この記事では、rTSS・NGP・IFの意味と違い、走行中と走行後の使い分け、数値を見るときの注意点をわかりやすく解説します。
rTSS・NGP・IFとは?3つの違い

rTSS・NGP・IFは、いずれもランニングのペースや負荷を理解するための指標ですが、見ている対象が異なります。
| 指標 | 示すもの | 主な使い方 |
|---|---|---|
| rTSS | 時間と強度を合わせたランニング全体の負荷 | 1回のランや週間負荷の比較 |
| NGP | 上り下りの影響を補正した、平地相当のペース | 起伏のあるコースでのペース判断 |
| IF | 自分の閾値ペースに対する相対的な強度 | 目的の強度で走れているかの確認 |
簡単に言えば、NGPとIFは「今、どの程度の強度で走っているか」を判断しやすくする指標で、rTSSは「その強度をどれくらい積み上げたか」を示す指標です。
rTSS:ランニング全体の負荷を見る

rTSSは「Running Training Stress Score」の略で、ランニングペースを基準に、運動時間と相対的な強度を組み合わせて負荷を数値化します。単に距離や時間だけを見るよりも、異なる内容のランニングを比較しやすいことが特徴です。
たとえば、短時間でも閾値付近で走るテンポ走は負荷が高くなりやすく、低強度のランニングでも長時間続ければrTSSは積み上がります。走行中にrTSSを確認すると、予定した負荷に近づいているかを見ながら、運動時間や強度を調整できます。
ただし、rTSSは疲労や回復状態を直接測る数値ではありません。同じrTSSでも、路面、気温、筋肉への負担、睡眠、体調によって身体の反応は異なります。自分の主観的な疲労感や痛みも合わせて判断しましょう。
▶︎TSSの種類やSuuntoアプリでの見方は「SuuntoアプリのTSSとは?種類・見方・トレーニング負荷への活用方法」で詳しく解説しています。
NGP:坂道を考慮したペースを見る

NGPは「Normalized Graded Pace」の略で、コースの上り下りによる影響を考慮し、その運動強度を平地でのペースに換算した目安です。
上りでは実際のペースが遅くても、身体には大きな負荷がかかります。反対に、下りでは速いペースが表示されても、心肺への負荷が同じとは限りません。NGPを見ることで、起伏のあるコースでも平均ペースだけに振り回されず、運動強度を捉えやすくなります。
NGPが役立つ場面
- アップダウンのあるロードコースで一定強度を保ちたいとき
- 坂を含むテンポ走やロングランを振り返るとき
- 地形の異なるコースでトレーニング内容を比較するとき
NGPは地形による影響を補正する推定値です。路面の状態、風、暑さ、標高、技術的な下り、疲労など、すべての要因を完全に反映するわけではありません。特にトレイルランニングでは、NGPだけで負荷を判断せず、心拍数や主観的運動強度も確認してください。
IF:閾値に対する運動強度を見る
IFは「Intensity Factor」の略で、NGPと自分の機能的閾値ペースを比較し、相対的な運動強度を示します。数値が1.00に近いほど、設定した閾値ペースに近い強度で走っていることを意味します。
TrainingPeaksとSuuntoの公式案内では、ランニングの目安として次の範囲が紹介されています。
- リカバリーラン:0.75未満
- エンデュランスラン:0.75〜0.85
- テンポ走:0.85〜0.95
- 無酸素性閾値インターバル:0.95〜1.05
これらは絶対的な合否ラインではなく、適切な閾値ペースが設定されていることを前提とした目安です。短いインターバルでは数値が安定するまで時間がかかる場合もあるため、ラップペース、心拍数、体感と組み合わせて使いましょう。
走行中と走行後の使い分け

3つの指標は、走行中の調整と走行後の振り返りで役割を分けると活用しやすくなります。
走行中:NGPとIFで強度を整える
起伏のあるコースではNGPを見て、地形の変化を考慮した強度を確認します。IFを併用すると、閾値に対して予定した強度で走れているかを判断しやすくなります。
たとえば、イージーランなのにIFが予定より高い状態で続いている場合は、ペースを落とす、坂では歩きを入れる、予定時間を短くするなどの調整ができます。
走行中:rTSSで負荷の積み上がりを見る
rTSSは走行時間とともに増えていくため、その日の目標負荷に対してどこまで進んだかを確認できます。ただし、目標値へ無理に到達する必要はありません。体調が悪い日や強い痛みがある日は、数値よりも安全を優先して中止または短縮してください。
走行後:3つの数値と体感を振り返る
走行後は、rTSS・NGP・IFに加えて、平均心拍数、心拍ゾーン、ラップ、獲得標高、睡眠、回復状態、主観的なきつさを確認します。同じコースや同じメニューを継続的に比較すると、自分にとっての適切な強度が見えやすくなります。
数値を活用するための設定と注意点
rTSSやIFは、自分の機能的閾値ペースを基準に計算されます。閾値ペースが実力と合っていないと、同じランニングでも負荷や強度が高すぎる、または低すぎる数値として表示される可能性があります。
閾値ペースを定期的に見直す
閾値ペースは、現在の体力やトレーニング状況に合わせて設定します。過去の自己ベストを長期間そのまま使うのではなく、体力の変化や直近のテスト結果をもとに見直しましょう。
異なる計算方法を混同しない
SuuntoアプリやTrainingPeaksには、ペースを基準にするrTSSのほか、心拍数を使うhrTSSなど複数の負荷指標があります。計算の基準が違えば数値も変わるため、推移を見るときは同じ種類の指標を継続して比較することが大切です。
▶︎心拍数を基準にした負荷については「hrTSSとは?心拍数でトレーニング負荷を測る方法」をご覧ください。
数値を追いすぎない
トレーニング指標は、意思決定を助けるための目安です。数値を達成するために無理をしたり、1回の上下だけでトレーニング効果を判断したりせず、数週間の傾向と身体の反応を合わせて見ましょう。
Suuntoでランニング指標を確認する

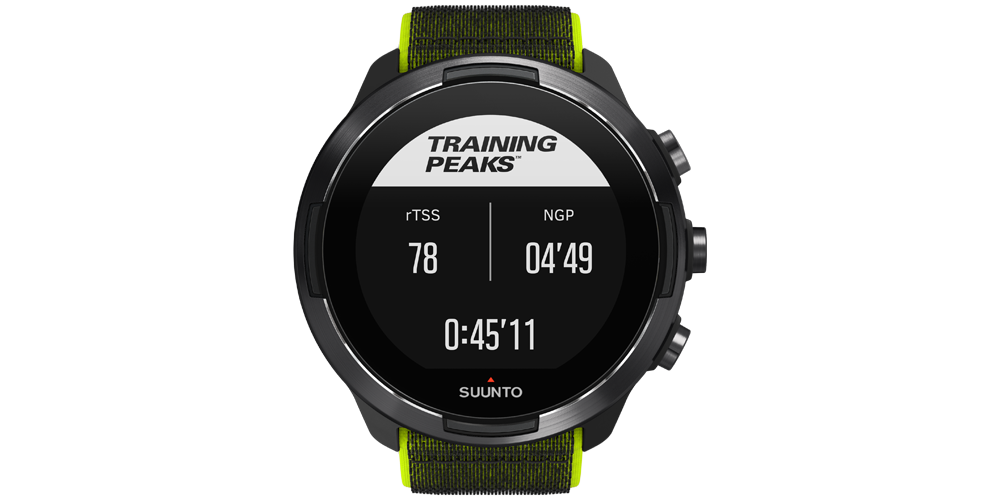
対応するSuuntoウォッチでは、SuuntoPlusの「TrainingPeaks - Running Pace」を利用し、ランニング中にIF・rTSS・NGPを確認できます。利用できる機能や画面は、ウォッチのモデルとソフトウェアのバージョンによって異なる場合があります。運動前にSuuntoアプリとウォッチを同期し、利用可能なSuuntoPlusスポーツアプリを確認してください。
Suunto Runは、わずか36gの軽量設計とデュアルバンドGPSを備え、ペースと距離の記録、ランニング向け機能、回復・睡眠・トレーニング負荷の確認に対応しています。走行中のペース管理から走行後の振り返りまでを一つにつなぎ、データを次のランニングへ活かしたい人に適した選択肢です。
rTSS・NGP・IFについてよくある質問
rTSSが高いほど良いトレーニングですか?
高ければ良いというものではありません。rTSSは負荷の大きさを示す目安であり、トレーニングの目的に合っているか、十分に回復できるかが重要です。低負荷のリカバリーランにも役割があります。
NGPと平均ペースはどちらを見ればよいですか?
平坦なコースでは両者が近くなることがあります。起伏のあるコースでは、実際の走行速度を確認するなら平均ペース、勾配を考慮した運動強度を考えるならNGPが参考になります。
IFが予定より高いときはどうすればよいですか?
まずペースを落とし、数分間の変化を確認します。暑さ、疲労、コースの勾配、閾値ペースの設定も影響するため、体感や心拍数も合わせて判断してください。
TrainingPeaksを使わなくてもTSSは確認できますか?
Suuntoアプリでは、同期したアクティビティのTSSと、その計算に使われたデータの種類を確認できます。TrainingPeaksは、計画や詳細分析をさらに行いたい場合の選択肢です。
まとめ
rTSS・NGP・IFは、それぞれ異なる角度からランニングの強度と負荷を見える化します。
- rTSS:時間と強度を合わせたランニング全体の負荷
- NGP:上り下りを考慮した平地相当のペース
- IF:自分の閾値ペースに対する相対的な強度
走行中はNGPとIFで強度を調整し、rTSSで負荷の積み上がりを確認します。走行後は心拍数や体感、睡眠、回復状態も合わせて振り返ることで、数値を次のトレーニングへ活かしやすくなります。


