


SUUNTOブログ


Ultra champ Courtney Dauwalter’s 6 tips for mental strength
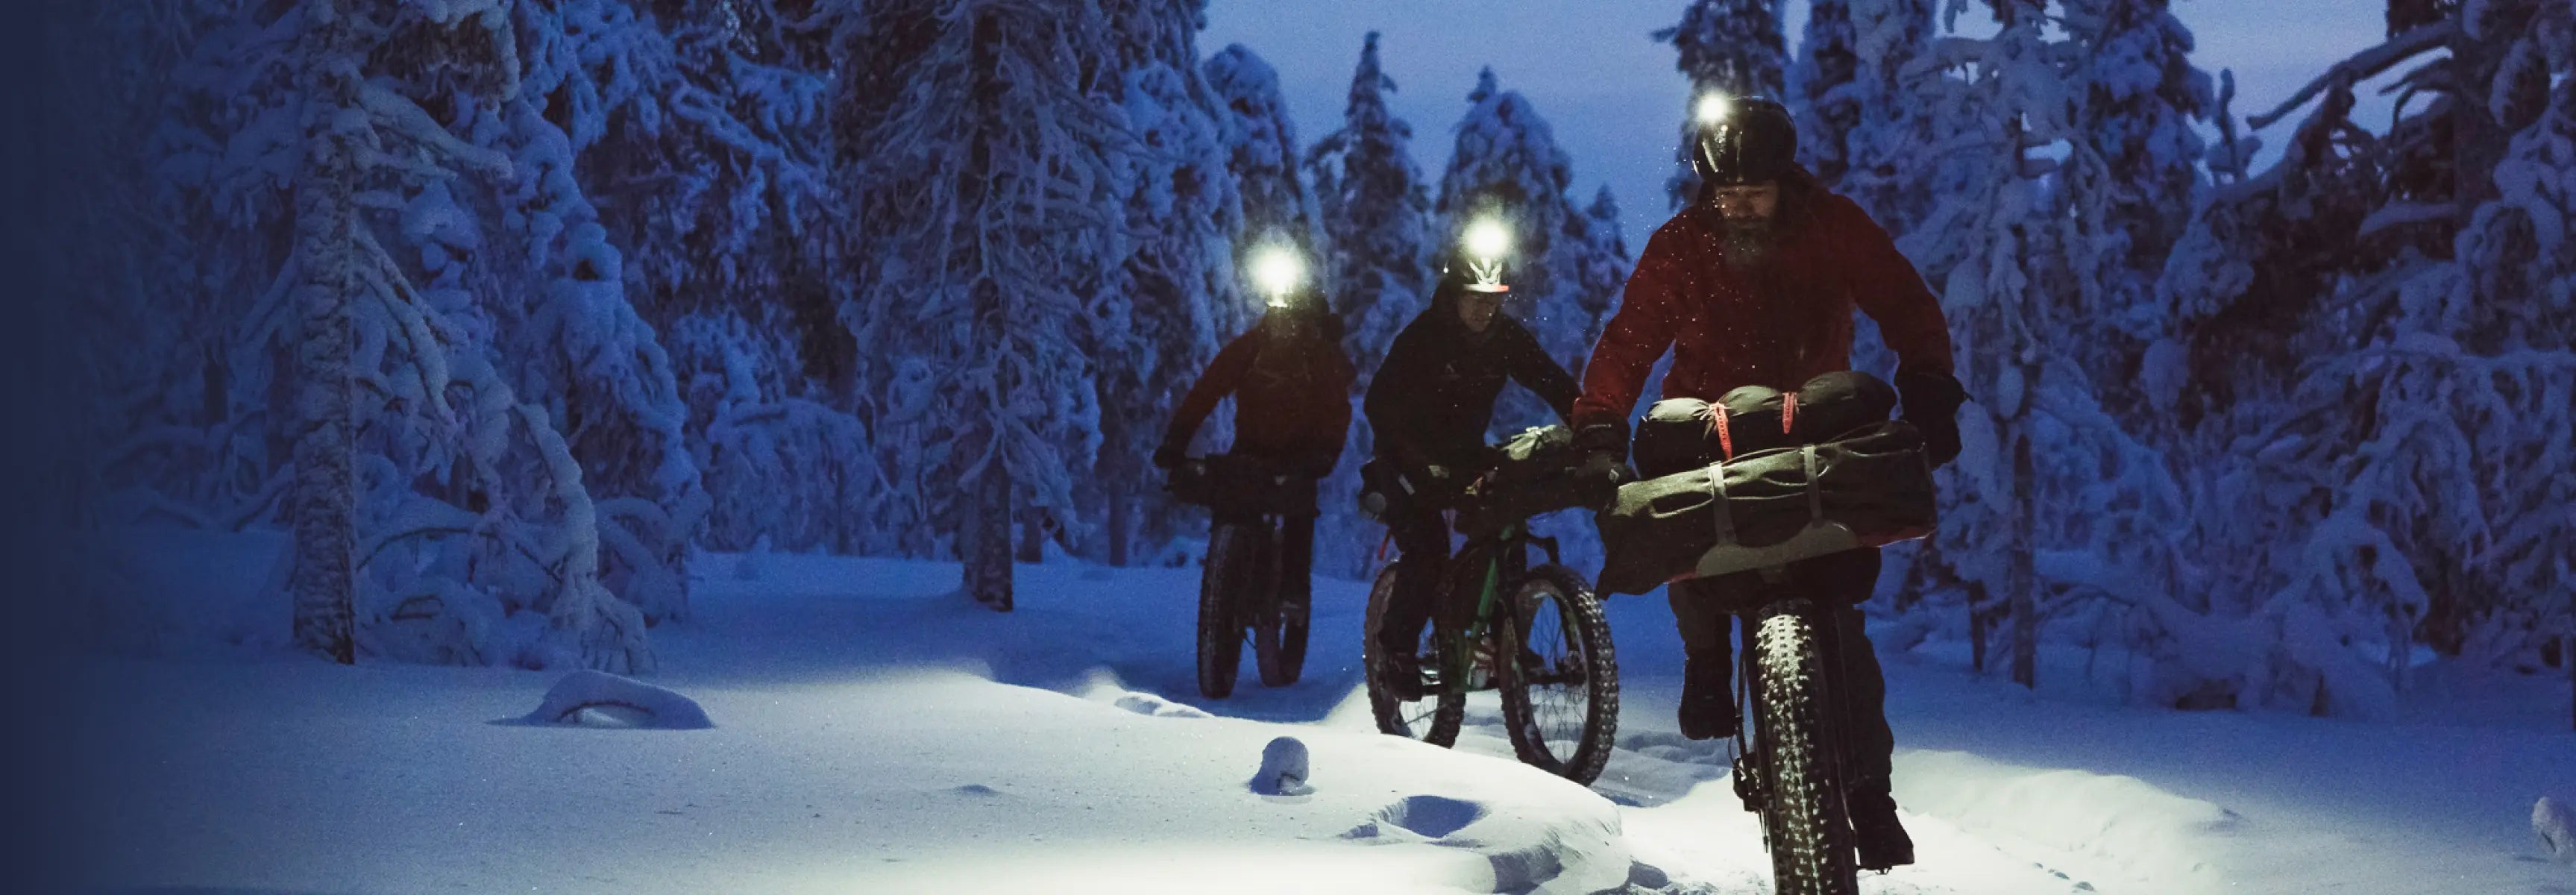
When Courtney Dauwalter is running an ultra marathon the buzz for her isn’t taking in the spectacular vistas, the changing light as the earth turns, or crossing the finishing line under her own steam, though she does love these.
The thing the UTMB 2019 champion most relishes is finding the entrance to the “pain cave”. Not because she gets pleasure from her own suffering, but because the cave is her own private laboratory to explore the power of the mind.
“What I keep discovering during these ultras is how powerful our brains can be,” the 35-year-old says. “Using that strength during a physical activity, tapping into my brain and using it to overcome the physical discomfort, is the main goal of doing an ultra for me.”
A former high school science teacher, Courtney sees ultra running as a kind of experiment into what her mind and body are capable of. The results have been impressive. She won the Western States Endurance Run 100 Miler in 2018, and was named Ultra Runner of the Year in 2018 by Ultra Running magazine after winning nine of the 12 races she entered.
We caught up with Courtney and asked her how she navigates the pain cave.
“I find a lot of comfort in being uncomfortable,” she says. “I call it the pain cave. It’s not a place I’m scared to enter. It’s a place I’m excited to find the entrance to.”
Stay present
Out on an ultra marathon we have a lot of time to think. The danger of this is that we get in a thinking feedback loop and ruminate on all sorts of things. That’s why Courtney tries to stay in the present moment. “Sometimes it’s about focusing on what I’m doing, how my body is feeling or just staying in the moment by breathing, taking another step, and breathing,” she says.
Flip the script
Courtney is a big advocate of staying positive no matter what happens. “Staying positive helps a bunch,” she says. “It’s so important not to get whirlpooled into panic about how awful you are feeling. Instead, flip the script in your head and tell yourself you’re feeling fine even if you’re not. It can be really powerful.”
Click to read more about Courtney!
Acknowledge it’s tough
As much as we want to stay positive and for everything to be rosy, let's face it, every ultra is going to bring us to a point where things kind of suck. Courtney says acknowledging how you’re feeling is important. “Sometimes you just need to wallow for a second,” she says. “If the negativity keeps knocking I’ll acknowledge how awful I’m feeling and how much it stinks to be puking in the bushes for hours, and acknowledging it lets me move past it to the next thing.”
Have a mantra
To help you flip the script, have your own mantra that you repeat to yourself again and again when the going gets tough. Courtney’s mantra is “I’m fine” and “everything is fine”. Try to keep it short and inspiring to you. “Put that track on repeat!”
Remember the evidence
Another tactic Courtney deploys when the going is tough, is to remind herself of the evidence she has that proves she is capable of enduring the hardship. “I’ll remember back to when I’ve been in the same boat and got through it; remembering the evidence, that this is something you have been through before, helps you to keep pushing and know it will be fine.”
Daydream
Sometimes Courtney takes a different tact; rather than engaging directly with what she is experiencing on an ultra, for example reframing negative thoughts into positive ones, instead she allows herself to check out. “Sometimes I try to totally disconnect from the race and think about my family and friends, different things going on in life, or about sitting on a beach with a tray of nachos,” she says. “It varies from being fully present and giving all my attention to the running motion, and to getting out of it and just daydreaming for some miles.”
All images by: © Martina Valmassoi
Read more articles
Courtney Dauwalter and her pursuit of mind power
Adapting to life in a time of pandemic
4 indoor workout tips for endurance athletes
How to adapt your training when the unexpected strikes
7 indoor training exercises to stay in shape


Courtney Dauwalter and her pursuit of mind power
© Philipp Reiter
Known for her speed, mental grit, sense of humour and funky running shorts, Courtney Dauwalter is always exploring her limits through ultra running. The Suunto ambassador lives in Golden, Colorado, and trains in the Rocky Mountains.
Time in the Rockies pays off; the former science teacher won the Ultra Trail Mont Blanc in 2019, placing 21st overall. The previous year she won the 100 mile Western States Endurance Run, finishing in 17h 27m – the second fastest time by a woman in the race’s history. The same year she stunned the ultra running community by coming second overall in the Big Backyard’s Ultra race, in which the goal is to run as many 6.7 km (4.167 mile) loops as possible. Courtney completed 67 laps and set the woman’s course record with a mind boggling 449.30 km (279.268 miles).
Raised in Hopkins, Minnesota, Courtney has loved running since her track and cross-country days in high school. She also excelled in Nordic skiing, winning the Minnesota state championships four times in her teens. While her family wasn’t into hiking or camping, Courtney says they spent most of their time active outside. “I run because I love it,” she says. “The challenge of it, just moving yourself by foot for all those miles, all those hours.”
© Philipp Reiter
She is fascinated by the power of the mind to help her overcome adversity and achieve incredible things. Gaining a reputation in the racing scene for being a man beater, Courtney has an innate understanding of how to use her mind to work with all the highs, lows and pain of ultra running. “I find a lot of comfort in being uncomfortable,” she says. “I call it the pain cave. The thing I’m seeking in these ultras is to reach the entrance of the pain cave so I get to go in. It’s not a place I’m scared to enter. It’s a place I’m excited to find the entrance to.”
While she has an intuitive approach to training, Courtney uses her Suunto 9 to track all her runs. “If during the week I’m feeling really tired I can look at my workouts and analyze what is going on,” she says. “Then I can see, for example, ‘Oh, it makes sense you’re exhausted because look how much climbing you’ve packed into the last five days’. It also tells me when my last rest day was. It’s a great way to look back and then reflect and figure out what things I need to adjust a little bit.”
Follow Courtney on her awesome ultra adventures via her Instagram feed.
Lead images: © Philipp Reiter
Read more articles
Ultra champ Courtney Dauwalter’s 6 tips for mental strength
12 must-read running articles to boost performance
How to adapt your training when the unexpected strikes


Adapting to life in a time of pandemic
Across the world athletes and adventurers are being confined at home. This does not come naturally to us, but like skilful outdoors people who know how to handle any eventuality in the backcountry, this situation also presents us with an opportunity to adapt, grow, and learn.
That’s exactly what members of our Suunto community are doing. We reached out to a bunch of Suunto trail and ultra runners and asked how they are “making the best use of a bad bargain”. And it turns out there are some unexpected upsides
Johan in France uses his trainer to stay active.
Accept the disruption
Everyone we spoke to reported their goals for 2020 have been disrupted. Johan in Nice, France was looking forward to a cycling race and to hiking the famous GR20 trail across the spine of Corsica – the race has been cancelled and the hiking trip delayed. Joaquin in Spain is confined at home and all his plans have gone out the window.
“At first it took me a while to accept it, but after two weeks I am now quite well adapted,” Joaquin says. “I am aware that we have to overcome this together, and the best thing at the moment is social distancing and being confined at home so the virus doesn’t spread and affect more people worldwide.”
Take it one day at a time
The temptation for many of us at the moment is to worry about the future and to compulsively follow the news about each twist and turn in the battle against coronavirus. Giving in to this temptation saps us of energy and creates anxiety. Instead, it’s more helpful to relax and be in the moment.
Majo is living in Manila and is quarantined at home, and only permitted outside to pick up groceries and medical supplies. “Things may change in 24 hours so I’m just taking it one day at a time,” she says. “I’m trying to make myself productive and sane until we can come back to our ‘normal’ life. We can use this time to reflect on what’s important in life and how we will spend it well after all of these unexpected events.”
To pass the time, Joaquin follows a daily routine, including cooking and exercising. “We’re also playing a lot of old boardgames that I had forgotten about,” he says. “It is really is incredible to rediscover these and play them with my wife so the hours pass faster and our confinement is more enjoyable.”
Joaquin is using his balcony to good end!
Stay active
It’s important to acknowledge training indoors just isn’t the same as running in a forest or hills. Acknowledge, accept and then move on. All of our community is keeping active in one way or another. Fortunately for Tobias, he can still head out for runs in a nearby forest. Majo, on the other hand, is making the most of being confined indoors. “I’m doing strength and conditioning exercises such as high intensity bodyweight training or interval training with dumbbells, yoga and stair workouts for cardio,” she says. “I don't have much workout equipment so I’m making the most of what I have.”
Maja in Sweden is living in the countryside, which sounds idyllic, but actually involves a lot of work. "Our sheep will be having lambs any day,” she says. “We have 33 chickens waiting to crack out of their eggshells (9 days left now!), we need to take home and chop/stalk firewood for next winter, plant all the veggies we’re gonna grow this summer, do some renovations on and in the house. Plus, we have a one year old that doesn’t always want to do the things above!"
Learn new skills
Based in the German Alps, Tobias is using the downtime to create his own topographical maps for future climbing trips. Majo is doing an online course to prepare in case her country requires more health workers to respond to the pandemic. She’s also taking online cooking lessons. Johan has taken up meditation. “I decided to use this time to start things I’ve wanted to do or learn for years, but never had enough time for,” he says. “There are tons of websites which give free online stuff to learn new skills.”
Ryan has taken advantage of online communiation technology to build community. “One new item that I implemented three weeks ago is a virtual group run/walk for my colleagues,” he says. “Every Thursday at 5:00 PM, I host a virtual group run where colleagues run/walk with me as I lead everyone through a workout. It is a fun way to get outside by yourself and meet new people!”
Fortunate to live in the German Alps, Tobias is still allowed outside to exercise.
Get inspired
Joaquin in Spain says for him it’s important to set and achieve a daily goal everyday. Ryan in California takes it a step further and says now is a time to set longer term goals, too. “This is a great time to set fitness goals!” he says. “Let’s use this time to consider what we want to accomplish in 2020 and 2021? Make clear, actionable, and attainable goals this year, and find a way to make yourself accountable. Share your goals with friends, workout buddies, or prospective coaches in order to help you stay accountable. Just because you can’t be in-person with someone right now does not mean you should lose your fitness accountability!”
To stay inspired, Joaquin also looks out for community initiatives to help out. “A good source of inspiration and motivation for the community are the multiple solidarity initiatives that exist, for example in Spain last Saturday there was an initiative to raise funds for COVID-19 research where more than 7,300 athletes ran in their homes and raised almost € 83,000,” he says.
Maja is staying inspired by following other ahletes online. "A lot of athletes are doing live sessions and Q&As in social media channels so take the time to ask them questions, train with them and make plans for future adventures, " she says.
Look on the bright side
Every cloud has a silver lining, they say, and even though this pandemic is causing so much suffering it’s causing a few positive things, too. Humans evolved what scientists call “negativity bias”; the tendency to be more attuned to spotting problems and threats than seeing the positive. This helped our species survive when we were regularly under threat. Now, however, we can turn this around and learn to focus more on the positive.
“Even though my heart is really breaking seeing people and health workers get sick, die and starve because of this pandemic, a positive side of the quarantine for most parts of the world is less pollution and more healing time for the Earth,” Majo says. “Some families are spending more time together which is also priceless. We also get to realize we can live with less than the usual. Nevertheless, I am really hoping and praying desperately that this will end soon so we can get back to normal, whether that will be a new normal or not.”
Lead image: © AlpineFex
Read more articles
4 indoor workout tips for endurance athletes
How to adapt your training when the unexpected strikes
7 indoor training exercises to stay in shape
12 must-read running articles to booste performance

12 must-read running articles to boost performance
The beautiful thing about running is its simplicity and the fact there are always little things – technique, economy, strength, pace etc – to work on to get better. Even if you’re pushing 70, you can still improve. It’s a lifelong journey.
We’ve been talking to top runners and coaches for many years, and have learned a lot in the process. There are so many aspects to improving running performance. Some of it is mental, some physical, and some commonsense.
For new and experienced runners alike, we’ve selected 12 ‘best of’ articles based on the conversations we’ve had with athletes and coaches. With so many of us confined to our homes, now is a good time to kick back and learn about the finer points of running. The fresh insights you gain will prepare you for an awesome running season once restrictions have been lifted.
Photo by Brian Erickson on Unsplash
How to adapt your training when the unexpected strikes
This is timely for many of us who are confined at home to help slow the spread of the coronavirus. Races scheduled in spring and summer have been cancelled, and the entire race calendar is uncertain. We talked to pro running coach Michael Arend about how to respond to this situation. Click here to see his tips.
7 principles to help you find the flow
We all want to experience the famous runner’s high; that blissful flow state when time flies by, and everything feels easy. But they can be elusive. Mental Coach Markus Arjava shared 7 principles to follow to increase the likelihood you find the flow. Read the article here.
Photo by Gregory Pappas on Unsplash
Learn how sleep can make you a better runner
Runners, especially distance runners, often expect a lot from themselves. We can get focused on our running volume, time on our feet, and all the other stats. They’re important, but can obscure the big picture; performance is a consequence of many things, including having quality time with your friends and family, diet, and of course getting plenty of sleep. Sleep doctor Henri Tuomilehto shared 6 tips to make sure you are getting good shut eye. Read more here.
Tracking cadence, heart rate and pace while running
Having the ability to track yourself while out on a run helps to improve performance. We talk to a coach about how to do this well to ensure you are training and racing intelligently. Get the lowdown here.
Photo by kike vega on Unsplash
Emelie Forsberg’s top 7 yoga poses for runners
To benefit from yoga asanas (postures) you don’t need to start believing in eastern spirituality. Physical yoga, practiced regularly, is just a great way to maintain and improve your mobility, muscle tone, fascial health and breathing. Emelie Forsberg is a trained yoga teacher and practices yoga daily. In this article, she demonstrates her 7 favorite yoga poses.
8 essential running form drills
Doing these 8 drills regularly will help to improve your running technique and economy. Sloppy technique leads to a loss of momentum and energy, making running more arduous. We talk to an XTERRA world champion and science driven endurance coach about how with a little effort you can tighten up your running form. Read it here.
© Graeme Murray / Red Bull Content Pool
7 tips for running in hot weather
Ryan Sandes has run ultras in deserts across the planet. In this article, he explains how to lower your core temperature when you’re out running on intense summer days.
Four myths about ultra running you need to know
There are a lot of assumptions about what it takes to run an ultra marathon. These often mistaken assumptions can discourage us from taking on what can be an incredibly transformative challenge. Ultra marathon coach Jason Koop sets us straight about the four common myths surrounding this sport, and why to give one a go.
© Craig Kolesky / Red Bull Content Pool
Fuelling the engine: 6 principles of nutrition for athletes
We spoke to six athletes and two coaches for our “fuelling the engine” series, and heard a variety of perspectives on eating well. We reviewed all the articles and found six principles they all agreed on. Read on to make sure you’re fuelling the engine well.
How to bring mindfulness to the trail
Mindfulness is being in the here and now. It’s nothing special, just present moment awareness, which in our attention economy can seem weirdly exotic. Mindfulness helps runners to develop a mind-body connection, says South African trail runner and coach Meg MacKenzie. It helps us tune in to what’s going on moment by moment, day by day. Read about Meg’s approach here.
7 tips to go the (ultra) distance
Who better to talk to about running an ultra marathon than Ryan Sandes, who recently ran the Great Himalayan Trail for goodness sake? His tips can equally be applied to training for a 30 km race as an ultra.
Intro to distance running technique
In this article, our science driven coach gets more specific than in the article above, and talks proper running form for distance. Working on these aspects of your running technique once or twice a week can pay dividends over time.
Lead images:
© Wayne Reiche / Red Bull Content Pool
© Kevin Sawyer / Red Bull Content Pool
© Graeme Murray / Red Bull Content Pool


4 indoor workout tips for endurance athletes
Endurance athletes aren’t built for the indoors. Heading out, exploring new trails, hills, and rides, while pushing our limits, is what makes us tick. Training indoors does, however, allow us to work on some of the finer points of our game, things we can’t address out on rides, runs or in the pool.
This time of pandemic, when we are being asked to stay at home, gives us an opportunity to tune up our bodies in ways we usually don’t make time for in ordinary times. If we train smart at home, then when the restrictions life we will be 100% ready to dive into our outdoor training.
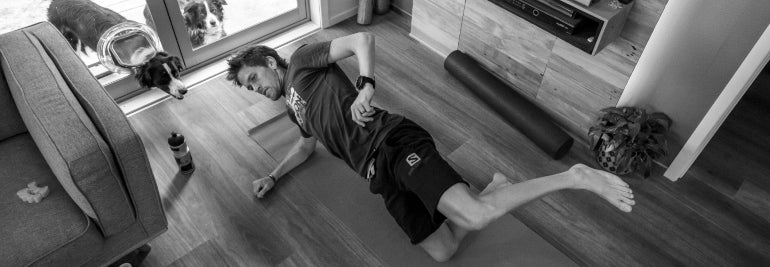
To give all you distance runners and triathletes confined indoors at the moment some inspiration, we talked to ultra runner Lucy Bartholomew, and triathletes Cody Beals and Mel Hauschildt about what they’re working on at home. They all had one thing in common: CORE WORK!
Face your core
There are no more excuses. “The time to lay that foundation and build a strong trunk has been forced on you!” Lucy says. “I love to do 15 to 30 minutes of core exercises, yoga and stretching and just more mat work and functional stuff. It doesn’t give you the sweat of a good run, but will certainly make that next run feel even more amazing.” Press play on the video above and join Lucy in one of her favorite core workouts!
Hit spin mode
If you have a training bike at home, put it on easy spin and pedal an hour or two away while watching your favourite Netflix series. “One of the sessions I do most often at home is an easy spin on the trainer while getting other work done,” Cody says. “I have my laptop in front of me and pass the time reading, researching, writing and emailing. I get some of my most focused work and creative thinking done on the trainer and the time flies!”
TRX and flex
Mel Hauschildt has a dedicated training room because working out there helps her to avoid distractions. She has a newborn baby, Dakota, who lies beside her while she, Mel, trains on her Kickr. “TRX cords are also very useful in working on endurance while stuck indoors,” Mel says. For inspiration, watch the video above, which shows how runners can use a TRX band.
Build power
Being confined indoors is no reason to stop training endurance fitness. Even if you don’t have a training bike or treadmill, there’s plenty you can do to build explosive power and maintain cardiovascular fitness. “You can do things like skipping outside, driveway sprints, jumping up stairs or DIY box jumps,” Lucy says. “Endurance is built for maintaining something for a longer duration of time so anything you do like star jumps, squats, burpees all build your cardio!” Need a challenge? Then press play above and join this skip rope endurance workout!
Read more articles
7 recover tips for immune fitness
How to adapt your training when the unexpected strikes
7 indoor training exercises to stay in shape

7 indoor training exercises to stay in shape
Training at home regularly is worth its weight in gold. It’s a good habit to build, and doesn’t need to take a lot of time or space. There are many things you can focus on at home, from plyometric training for explosiveness, strength training for stability and stamina, and also mobility training to maintain the range of motion in your joints. There is a huge potential for improvement!
© Graeme Murray/Red Bull Content Pool
Suunto #indoorchallenge!
Given many of us are confined indoors due to the coronavirus crisis we decided to share indoor training inspiration. We invited some of our athletes to participate in our indoor training challenge. Each one will share a short work out and then tag the next athlete to share his or her’s. Your job is to do them!
To protect society’s most vulnerable people from the coronavirus, the best thing we can all do to #flattenthecurve is accept social distancing measures and to stay at home if instructed by authorities. Keep in mind this situation won’t last forever.
The first video is from ultra runner Ryan Sandes who is currently in lock down in Cape Town, South Africa. Sandes says he focuses on mobility work and strength training at home. “Being stuck at home is a good opportunity to do lots of mobility and strength training to make yourself a better runner and to give you better longevity,” he says.
Click play to follow Ryan's indoor workout!
Improve your mobility
Mobility training involves exercises that improve the range of motion in your joints. Many runners, for example, work on hip and spine mobility because of the repetitive nature of running and how this can, over time, reduce mobility in these areas.
“For every one hour of running you do you should do at least 15 minutes of mobility work,” Ryan says. “Training at home is a great opportunity to develop good movement.”
Blast your core
Mountain athlete and Suunto ambassador Emelie Forsberg and her partner Kilian Jornet take turns training outdoors and staying at home to look after their baby daughter. She does one indoor training session everyday and usually focuses on core strength.
“I like to do a short 10 to 15 minute core workouts,” she says. “I write down the exercises, put on my watch and go! No rest in between the exercises, I just go for the whole 10 to 15 exercises. If I feel really motivated I’ll do it twice.”
Do stair hops
To give his quadriceps a work out while he’s at home, Ryan Sandes does reps of hopping up and down stairs. “Be creative, and think outside the box,” he says. “Remember, anything is better than nothing.”
Let loose and dance!
Studies have shown that dancing regularly has numerous health benefits, including warding off degenerative brain diseases. Training doesn’t always need to be structured and serious; instead follow Emelie’s example, and build in some boogie while you’re stuck at home.
“Put on your favourite music and go for it!” she says. “Or do aerobics, Zumba, jumps, lunges, burpees – whatever gets you going!”
Watch sports and move
Mountain athlete and Suunto ambassador Kilian Jornet does one indoor workout at home every day. “I believe one the best things to do is to watch sport shows, live or repetitions, or films about sport,” he says. “This way we get inspired and we can relate our training to what we are watching.”
Run in your garden
Running lengths or around in circles in your garden, if you have one, doesn’t sound like too much fun, but according to Sandes it has two benefits.
Firstly, it’s good mental training; boredom is an inevitable part of long distance running, and staying present and motivated requires mental focus. Practicing at home in this way can develop this. Secondly, it’s an opportunity to work on your running technique. If you have a backyard, work on the key aspects of good running economy.
Skip to endurance
To maintain your base cardio fitness, Kilian Jornet suggests skipping. Do three minutes skipping, rest for a minute, and then skip for another three minutes. Do at least six three minute intervals. You’ll need a towel!
Lead image: © Graeme Murray/Red Bull Content Pool
Read more articles
7 recovery tips for immune fitness
Emelie Forsberg's top 7 yoga poses
8 essential running form drills


