




Suunto Blog


Triathlon transition tips from the Caveman
Legendary South African triathlete Conrad Stotlz, known fondly as the Caveman due to his large stature and rough and rugged ways, knows well how to dominate a triathalon.
He's a four time XTERRA Triathlon World Champion and a three time ITU Cross Triathlon World Champion and mountain biking is his strongest discipline.
In this video he shares his tips to transition from swimming to mountain biking. The Caveman shows us how to do it like a pro.
Meet Conrad face-to-face in episode 5 of the #SuuntoAdventure video series.
Click here to read about how Conrad earned the nickname Caveman

HOW TO USE AMBIT3’S RECOVERY FEATURES
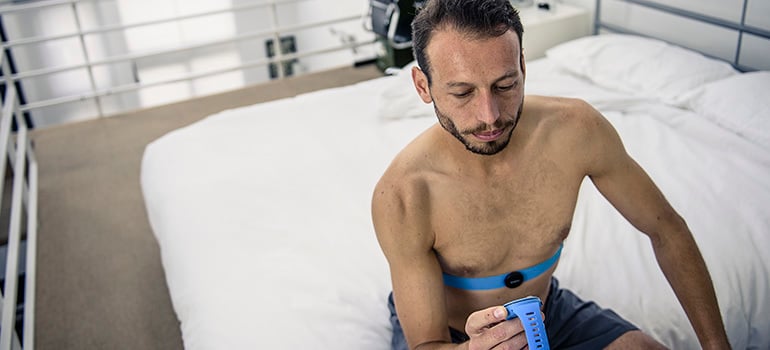
To help you balance your training Suunto Ambit3 has two recovery indicators: recovery time and recovery status. Read on and learn how to take advantage of these features.
RECOVERY TIME
Recovery time is an estimate of how long your body needs to recuperate after training. The time is based on the duration and intensity of the session, as well as the overall fatigue, accumulating even at lower intensities. Recovery time accumulates from one session to the next, if you train again before the time has expired. A graph of your recovery time is displayed as one of the screens in the time mode. When entering the logbook, the recovery time in hours is displayed on the screen.
There is one important point to remember: the time is an estimate that is based on activities you have done with your Ambit3. It doesn’t have information about other aspects of life. Did you sleep enough? Do you have flu? Was your meal nutritious and helpful for your recovery?
To get an accurate indication of your actual recovery state, we recommend using one of the two recovery tests.
REVOVERY STATUS
Recovery status indicates the amount of stress on your autonomic nervous system. The less stress you have, the more recovered you are. Knowing your state of recovery helps you optimize your training and avoid over training or injury.
You can check your recovery status with a quick recovery test or sleep recovery test, powered by Firstbeat. The tests require a Bluetooth-compatible heart rate sensor that measures heart rate variability (R-R interval), such as Suunto Smart Sensor.
Your recovery status is indicated with 0-100% result scale.
Result & Explanation
81-100 Fully recovered. OK to train up to very hard intensity.51-80 Recovered. OK to train up to hard intensity.21–50 Recovering. Train easy.0-20 Not recovered. Rest to recover.
The more serious you are with training and the more tests you do, the more important details are, also in the test results. For a top-level athlete a difference of five points in recovery status may be meaningful where as an active runner will be happy with the four point scale presented above.
When entering the logbook, recovery is displayed as your estimated recovery time; if a recovery test is done within the past 24 h and after your previous move, the display will show the result of the last test. This assuming the recovery has been calibrated (see next chapter).
CALIBRATING THE TESTS
When you first start using Ambit3’s recovery tests the watch needs to be calibrated in order to provide accurate, personal results. The calibration tests define what 'fully recovered' means for your body. With each calibration test, your watch adjusts the results scale of the test to match your unique heart rate variability.
You need to perform three calibration tests for both sleep recovery and quick recovery tests. The calibration tests do not need to be done in sequence, but they need to be at least 12 hours apart. These need to be done when you have no accumulated recovery time. Ideally, you also feel fully recovered and are not ill or stressed during these calibration tests.
During the calibration period, you may get results that are higher or lower than expected. These results are indicated in the watch as your estimated recovery status until the calibration is completed. Once you have completed the calibration, the latest result is displayed when you enter the logbook instead of recovery time.
SLEEP RECOVERY TEST
The sleep recovery test, powered by Firstbeat, provides a reliable indicator of your recovery status after a night's sleep.
To perform a sleep recovery test:
Put on your heart rate belt and ensure the electrodes are moist.
Press [Start Stop], scroll to RECOVERY with [Start Stop], and select with [Next].
Scroll to SLEEP TEST and select with [Next].
If you want to cancel the test, press [Back Lap].
When you are ready to get up in the morning, end the test by pressing [Start Stop] or [Next].
The sleep recovery test requires at least two hours of good heart rate data to produce results. The test does not take into account the length of the night meaning you can get similar results after a six-hour sleep and an eight-hour sleep.
If you use your Ambit3’s alarm function, set the alarm first and then start the test. And in the morning stop both your alarm and your sleep recovery test.
During the test you will see the time and SLEEP TEST on the bottom row of the screen.
And last but not least: don’t worry if you have to get up in the middle of the night. This doesn’t make your test unreliable. The test selects the best two-hour period of your sleep and analyzes that.
QUICK RECOVERY TEST
The quick recovery test, powered by Firstbeat, is alternative way to measure your recovery status. The sleep recovery test is a more accurate method to measure your recovery status. But for some individuals, wearing a heart rate sensor throughout the night may not be feasible.
The quick recovery test only takes a few minutes. For best results, you should lie down, stay relaxed, and not move around during the test. We recommend performing the test in the morning after waking up. This helps ensure you get comparable results day to day.
To perform a quick recovery test:
Put on your heart rate belt and ensure the electrodes are moist.
Lie down and relax in a quiet environment free from disturbances.
Press [Start Stop], scroll to RECOVERY with [Start Stop], and select with [Next].
Scroll to Quick test and select with [Next].
Wait for the test to complete.
When the test is complete, scroll through the results with [Next] and [Back Lap].
TROUBLE SHOOTING THE RECOVERY TESTS
There are basically two reason for the tests to fail:
Bad skin contact or low HR belt battery will generate bad data and the test will fail.
If you are too stressed for the test, like right after a training session, the test is likely to fail.
The results of the tests do not impact your estimated recovery time.
Read more about the feature in Firstbeat’s scientific white papers:
Recovery Analysis for Athletic Training Based on Heart Rate Variability
Stress and Recovery Analysis Method Based on 24-hour Heart Rate Variability
Read more Tutorial Tuesday articles at tutorialtuesday
Get support for your Suunto product and find user manuals at support


Face to Face with Conrad Stoltz, #SuuntoAdventure Video Series Episode 5
In the fifth episode of #SuuntoAdventure Video Series four time XTERRA world champion Conrad Stoltz talks about going fast, suffering and over 25 years of competing in triathlon.
Face to Face with Conrad Stoltz, #SuuntoAdventure Video Series Episode 5
Watch also the other episodes in the series:
Face to Face with Emelie Forsberg – #SuuntoAdventure Video Series, Episode 1
Face to Face with Greg Hill – #SuuntoAdventure Video Series, Episode 2
Face to Face with Kilian Jornet – #SuuntoAdventure Video Series, Episode 3
Face to Face with William Trubridge – #SuuntoAdventure Video Series, Episode 4


AERO WHEELS WILL MAKE YOU FASTER
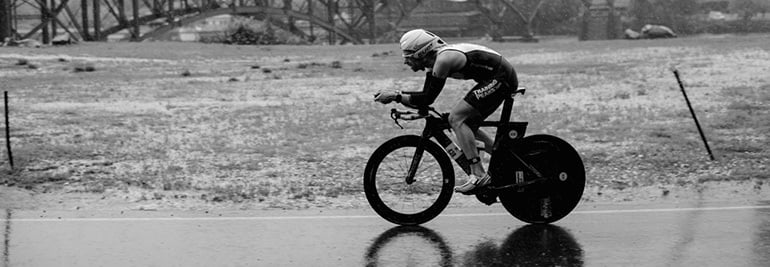
High profile aero wheels used to be regarded something that were mostly used in time trials and triathlons. But in recent years aerodynamics and aero wheels have taken off in road cycling as well. Decrease in aerodynamic drag and increase in speed are a welcome addition to any cyclist.
Aerodynamic drag is the main form of resistance working against a cyclist. The benefits of being more aerodynamic are most obvious for fast riders but it helps in slower paced riding too as more time will be spent in the wind.
The most effective way to decrease your drag is to optimize your riding position on the bike. A reduced frontal area will increase the speed – and save you energy.
On the equipment side one of the most important ways to improve aerodynamics is to use high-performance aero wheels. Wheels play a key role in aerodynamics since the front wheel is pushing through the air first. Its shape is complex.
The most crucial part of the aero wheels is the height of the rim as well as its width and overall shape. The profile of the rim smoothes the air coming around the tyre and rim. Basically the higher the profile, the less drag the wheels produce. For this reason full disk wheels are the most aerodynamic – and the fastest. However, disk wheels are more difficult to use in cross winds.
The rim height and profile are not the only components affecting the aerodynamics of a wheel. A wheel is an entity where every component from rims to spokes, hubs and tyres have their own role and effect on performance.
The overall rim-tyre shape improves the riding characteristics of high profile wheels in windy conditions. When both together are forming a perfect airfoil shape (NACA profile), side wind resistance is reduced and stability improved. This makes 60 mm tall rims pretty easy to ride in much more conditions than one would think.
A great example of this is Mavic’s integrated wheel-tyre systems. They smoothe airflow around the tyre and wheel, and improve streamlined airflow at every yaw angle.
Mavic Cosmic CXR 60’s unique CX01 technology unifies the rim and tyre together, saves time and watts in every condition and provides high stability in crosswind. Their 60 mm wind tunnel optimized rim profile with extra-light carbon rims fitted with Yksion CXR tyres enable a very dynamic ride.
Action images: © Loris Von Siebenthal / Mavic

BENEFITS FOR USING TRAININGPEAKS WITH YOUR SUUNTO
Suunto became compatible with TrainingPeaks this spring. We got in touch with Canadian ultra runner Rodney Buike to learn more about the service.
Rodney Buike started his athletic career as an alpine ski racer and a mountain biker but has since evolved into an endurance athlete covering longer and longer distances. First he competed in duathlons and triathlons, but has recently started to run ultras, too.
Buike has been using TrainingPeaks as his main tracking application since 2011.
“I initially started with the free version of TrainingPeaks but soon switched to TrainingPeaks Premium for some of the added capabilities,” says Buike.
“For me the best feature is the Performance Management Chart. It gives me a real ability to manage my fitness and fatigue levels over the course of my racing season.”
TrainingPeaks’ Performance Management Chart (PMC) tracks chronic training load (CTL based on activities older than 15 days) and acute training load (ATL based on the last 14 days of activity). These numbers are based on the athlete’s thresholds which allows TrainingPeaks to calculate the intensity (IF) and Training Stress Score (TSS). This is then used to calculate Training Stress Balance (TSB). All this data can be used to monitor progress and ensure a smooth steady build up and then taper to main race or races.
Here’s Buike’s own PMC starting with the beginning of training for his first 50K race.
Rodney Buike’s 180-day Performance Management Chart
“The first vertical red line is the peak of training with the longest run before tapering began for the race (the next vertical red line). Then you can see the recovery period and the final vertical red line indicating when training began again,” Buike explains.
“There are a few important things you can see in this graph: First off you can see a long slow steady build with the gradual increase in the CTL (the blue line). There are smaller spikes along the line, which individually identify the key long runs followed by short recovery periods – but an overall steady climb. The TSB (orange line) moves into the positive as I recover and taper for the race while the ATL drops as training load is decreased.”
Over the course of time the Performance Management Chart can help you plan your taper and recovery to ensure you are doing just enough to maintain fitness while recovering properly to ensure your best performance on race day.
SET YOUR ZONES FIRST
While this all sounds very complex there are a few very basic things that all athletes can take advantage of immediately.
“The first thing I recommend is to set your zones. If you are using HR based training you can set different zones for all activities. For specific activities you can also define additional zones. I highly suggest runners to set their pace zones, which can be done using the results of a recent 10KM running race. Cyclists, who have a power meter, can input their functional threshold power (FTP) and use that to build power zones.”
In addition to the Performance Management Chart, Buike highlights the premium version’s advanced charts that you can use to drill deeper into the data (power analysis, scatter graphs, etc.). He also finds the planning tools very useful.
“With the premium version you have the ability to plan out your upcoming week, month or longer and have that sync with your calendar in Outlook, Gmail, Apple iCalendar or any calendar tool that supports ICS files. When you upload activities they will automatically populate the related activity in your TrainingPeaks calendar,” says Buike.
So how does your own calendar look for the coming weeks?
“I have decided to move into the ultra running world and completed my first 50 km and 80 km races recently. In May I have a 130km race coming up.”


TUTORIAL TUESDAY: WHERE AM I? FINDING YOUR LOCATION WITH AN AMBIT
Figuring out where you are is fairly simple when you have a map, the visibility is good and you can identify a few landmarks. But when the going gets rough, the weather is against you and the sun sets, the task isn’t so simple any more. In this tutorial you will learn how your Ambit can help you to find your location.
The basics are simple: you can find your current position with a few clicks of the Ambit.
Choose: Navigation – Location – Current
To make sure you get the satellite fix as quickly as possible, remember to sync your Ambit regularly and keep it up to date.
Once you have found the GPS signal you will get your current location in geographic coordinates. The most common coordinate system in GPS devices is WGS84, which is also used by default in Suunto GPS watches.
Use the same coordinate system on your watch and map
If you need to give your exact location to someone in a rescue situation, WGS84 works. But when you start using a map and defining your location on it, you will need to make sure your GPS watch and the map use the same coordinate system. (To change your Ambit’s coordinate system go to General – Formats – Position format.)
Latitude/longitude is the coordinate system used in marine navigation and is common on topographical outdoor maps. Latitude lines run horizontally. The zero latitude is the Equator. Longitudes run vertically and the zero longitude runs through Greenwich, England. The latitude is normally the first number expressed in lat/long coordinate (for example 60°16'19" N 24°58’23’’ E).
WGS84, which uses latitudes/longitudes, is actually more than a coordinate system: it also includes a model of the globe that enables the use of GPS altimeters.
UTM is a grid coordinate system that is used on many outdoor maps. It divides the map into a perpendicular grid in which each of the squares are the same size anywhere on the map. This means the coordinate system is tied directly to a distance in meters.
This Norwegian map has both WGS84 (black) and UTM (blue) coordinates.
The black numbers on the sides of the map are degrees latitude; the numbers on the top and bottom of the map are degrees longitude. To determine your location on the map, draw a west to east line through the corresponding latitude and a south to north line through the corresponding longitude. The intersection of the two lines indicates your position.
The blue numbers are the northings and eastings of the UTM coordinate system. You can use them like the lat/log when finding your location on the map.
You can get support for your Suunto product at support


