


Suunto Blog


How to find your way in the mountains
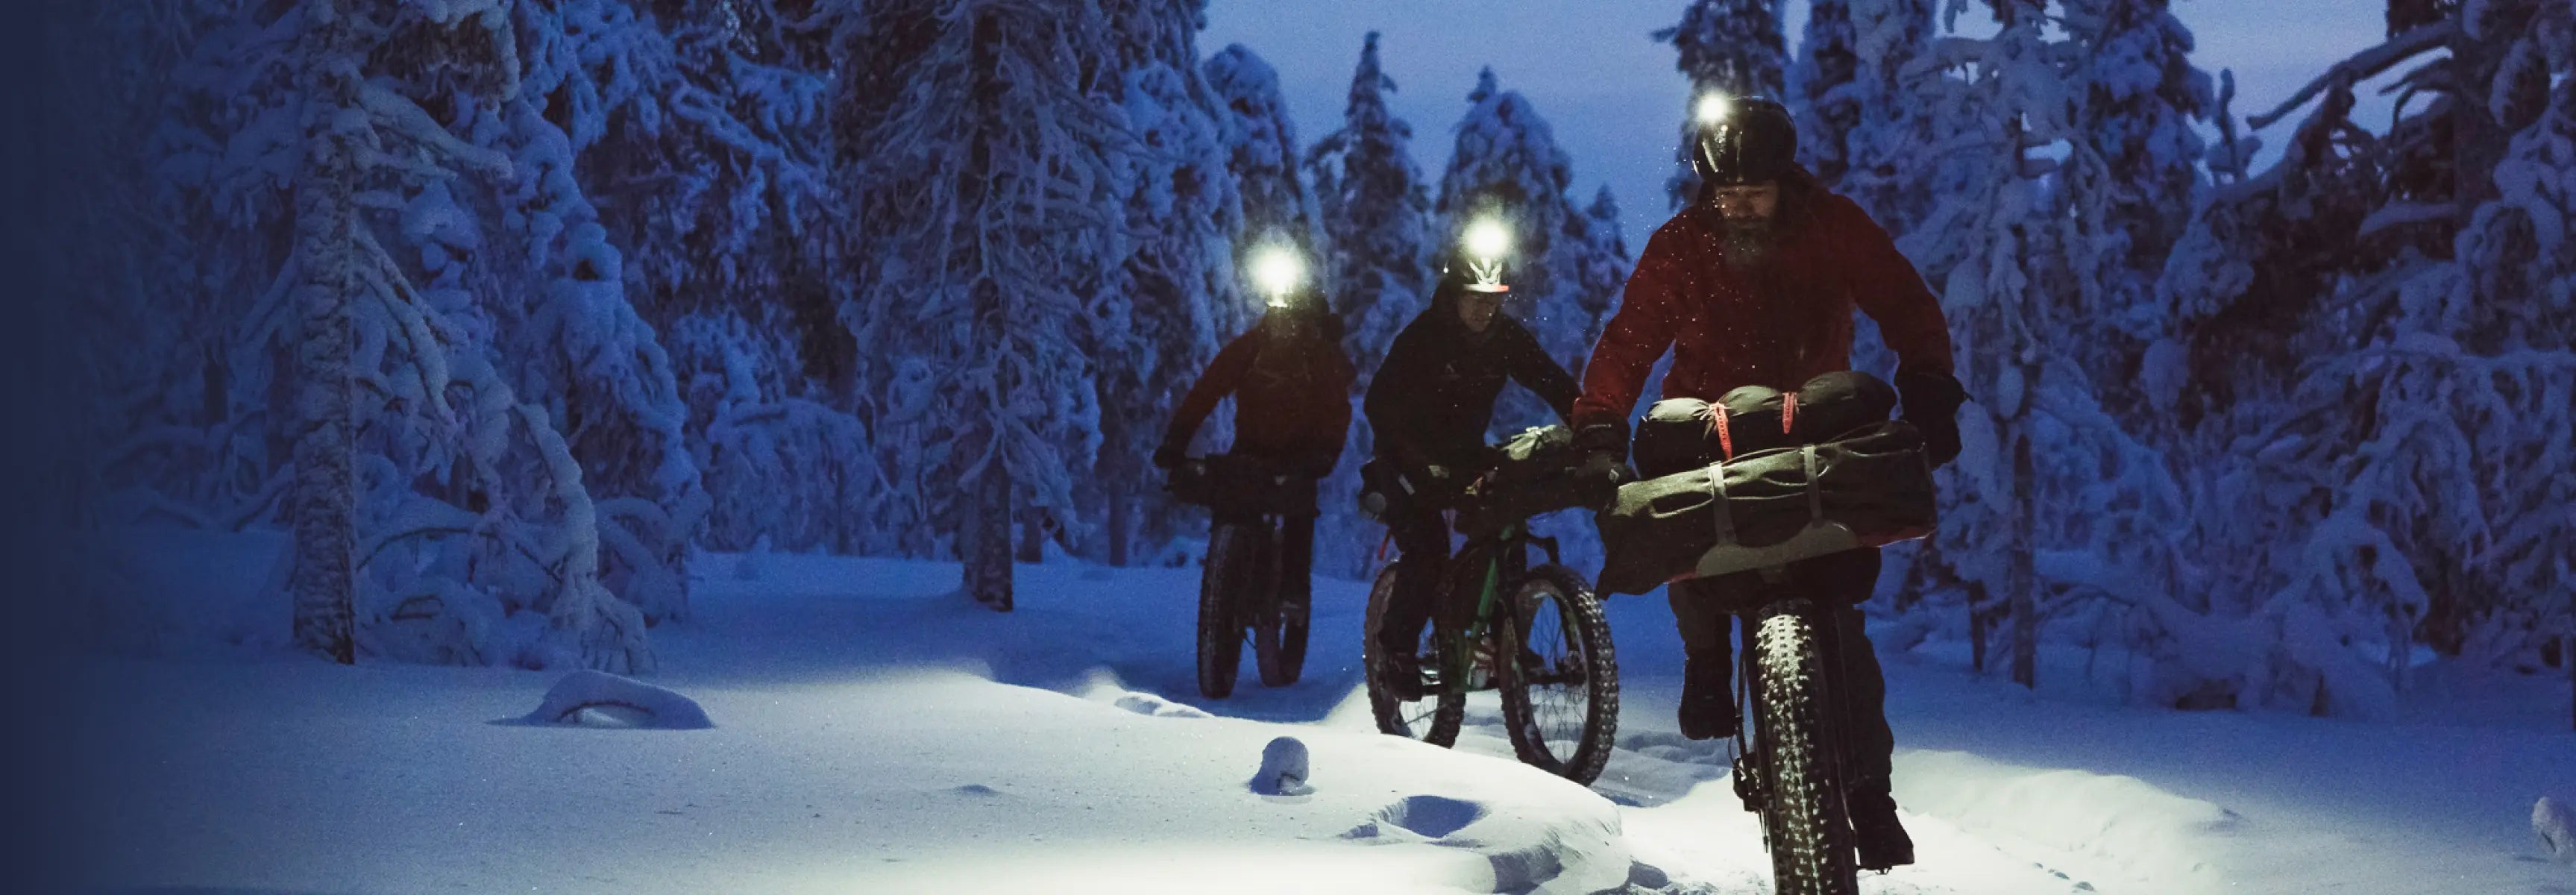
The more people in the group who can navigate confidently the safer it is. © Arc'teryx / Piotr Drozdz
Knowing how to read a map, use a compass and find a safe route through the mountains are essential outdoor skills for hikers, climbers, mountain bikers and trail runners. These skills, the basis of good wayfinding, make our adventures safer and more enjoyable.
In this series of articles, Terho Lahtinen, who works in Suunto’s Emerging Business team, will explain how to develop these essential mountain navigation skills. Terho was lead navigator in an adventure racing team that competed all over the world for eight years. He recently led a clinic on wayfinding at the Arc'teryx Alpine Academy, and helped dedicated adventurers gain greater confidence on their trips.
“The confidence that comes from knowing how to navigate in the mountains helps you to relax on their trips, making them more enjoyable,” Terho says. “Location awareness, map reading and compass orientation are also fun in of themselves.”
In this first article of the series, Terho explains where to begin to develop your wayfinding ability.
Don't be dependent
Yes, it’s true we have GPS nowadays, but digital navigation technology isn’t a replacement for these essential skills; as we explain below, mobile phones and GPS devices should play a support role only.
What happens, for example, if your smartphone runs out of batteries or falls in a river? What if the reception sucks? Or you are dependent on someone in your group to be the navigator and he or she gets it wrong? The more people who know how to navigate the safer the group.
Even if you usually follow well marked trails, knowing how to navigate with a map and compass can come in handy. A few moments of distraction while passing a fork in the path, and you could go in the wrong direction and an hour or so later find yourself wondering where the heck you are. It happens.
Location awareness is key
It all starts here. Without this ability, the other skills will be shaky. Location awareness is more than just knowing where you are. “It’s an attitude of consciously and constantly observing things around us and a sensitivity to notice the essential landmarks,” Terho explains. “It’s almost an intuitive feeling for the landscape around you.”
This honed sense of location awareness makes orientation more straight forward. Orientation is the attempt to determine one’s location by relating your position to nearby objects or landmarks. This depends on being able to relate what you see around you to what you see on a map. It takes time to develop this, but with regular practice it will come.
Start observing
To cultivate location awareness, learn to be more observant. “Start observing things around you, studying maps, correlating map information and the real world to each other, and it gets more and more interesting every day,” Terho says. “If you are using phone apps for navigation, stop using automatic guidance and just use your location on the map, choose the way yourself, and study what’s around you and how it appears on the map or a satellite image.”
The more you use topo maps, the more you’ll come to love them. © Arc'teryx / Piotr Drozdz
Practice with topographical maps
We all agree that Google Maps is possibly the next best thing to sliced bread. It is immensely helpful when running late for an appointment while navigating in an unfamiliar city, for example. But digital technology has its limitations, too. We should avoid becoming dependent on it.
Terho suggests buying a topographical map of an area you know well and start studying the map and relating what you see around you. Doing this over time will give you a sense of how maps communicate land formations.
“Paper maps never run out of batteries and they won’t break if they fall on the ground,” Terho says. “They contain much more detailed terrain information than most digital maps and are much more practical for planning and for studying larger areas and longer routes.”
Learn the contours
The number one thing to learn is correlating contour lines on the map and topographic shapes in your surrounding landscape to one other. The map should tell you what you can expect to see around you. With time and practice, you get a feeling for this.
“Contour lines describe the shape of the earth’s surface and that’s the most important information on any map for outdoor activities,” Terho says. “Studying maps at home is a great exercise for getting the feeling, comparing map and actual terrain is even better.”
Practice makes perfect
In each article of this series Terho will suggest some homework for you to do to cultivate your wayfinding skills. This first article’s homework will keep you busy!
Map study
Get a terrain map for an area you know well (where you won’t get lost). Study the map at home, spot familiar places on the map and find out how they are illustrated. Compare the map with your memory of those locations.
Terrain recognition
Remember your latest activity in the map area and identify your route on the map. Study the contours lines and look at the intervals between them. Where are the hills? How high are they? Are there any valleys, ridges, gorges, or saddles? Is the slope in a specific location steep or flat? What is the highest point on the map? The lowest? Where is the steepest slope?
Field study
Time to take the map into the field. When you’re out there, align the map with the surrounding terrain (north on the map pointing to the north in the terrain). Look around at what you see and compare it to your map. This can be visualized by imagining the map is fixed to north and you are walking around it, depending on which direction you are going to or looking at. If you are looking south, you are on the north side of the map and north on the map is pointing at you. When changing direction, you are turning, not the map. You are always holding the map in front of you and the map is pointing to north.
Now, choose a route that you’re familiar with. Follow your progress on the map, and spot every detail that’s drawn on the map and identify them in the terrain. This is a great way to learn how the map and the terrain relate to each other.
Panoramic view
Find a spot where you have a sweeping view of the landscape. Keep the map aligned, north pointing north, with the terrain. While looking in different directions, find distinctive terrain features, such as cliffs, peaks, valleys, buildings, and rivers and then locate them on the map.
Guide a buddy
Head into familiar hills with a friend. Make a route plan in advance, explain the plan to your friend including the different terrain features and other objects you are going to use for navigation waypoints. While out there, explain all the things you observe in the terrain and show where they are on the map. Then let your friend do the same.
Stay tuned for the next article in the series: how to plan your route through the mountains!
Lead image: © Arc'teryx / Piotr Drozdz
Read more articles:
7 tips to find a safe track up the mountain
8 avalanche safety checks to tick off before the ski season
Born to shred in the Arctic
Proving electric adventure is the future

Fuelling the engine: 6 principles of nutrition for athletes
When she's not in the mountains, you can find Emelie Forsberg in her garden or preparing delicious meals. © Matti Bernitz
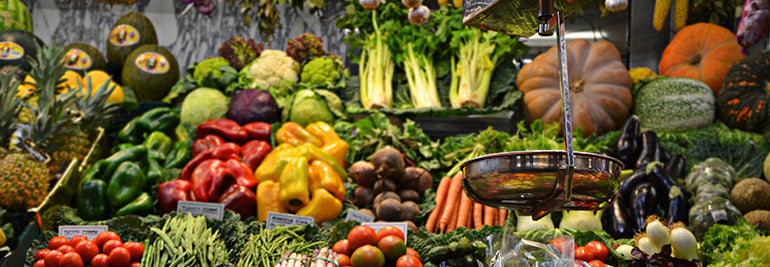
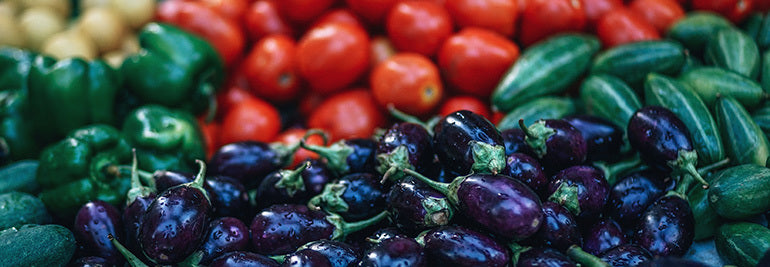
How and what we eat is personal to each one of us. Some of us feel better and more energised by certain foods, while others feel quite differently. Regardless of our personal view, one thing we all have in common is that eating well is essential for top performance.
In our recent article series “Fuelling the engine” we heard from eight athletes and trainers about how they stay fuelled (see the end for the article list). What’s more interesting than their differences, is what they have in common. We’ve combed through and put together six basic principles of nutrition for athletes.
Find your rhythm
Suunto HQ is lucky to have in-house personal trainer and athlete Matias Anthoni walking around the office. He offers training and nutrition advice to whoever is interested. He says improving how often you eat can improve what you eat. Skipping meals is a no-no for dedicated athletes because it causes energy crashes and bad dietary decisions, which result in poor performance. He advises to get into a rhythm of having a healthy meal every three hours.
Get organized
To eat six or more well balanced meals a day demands forward planning. It’s pretty hard, if not impossible, to maintain this if you’re operating on a day-to-day basis. Ryan Sandes, Emelie Forsberg, Mel Hauschildt and Lucy Bartholomew all emphasised the importance of being well organised and planning ahead. They sometimes make extra portions of meals at the beginning of the week to have later in the week when they know they will be busy. Being organised means making sure there are plenty of easy, go-to meal ingredients available, too.
Balanced meals
There are a number of different aspects to having a balanced diet. Ultracycling man Omar di Felice sees it as maintaining a proper balance of carbohydrates, protein and fat, with fatty food being essential for his epic extreme rides above the Arctic Circle every winter. This balance of carbohydrates, protein and fat is what nutrition expert Dr. Rick Kattouf II also drills into his clients. He believes every meal – for dedicated athletes in training – should include this ratio: 50 to 60 % carbohydrates, 15 to 25 % protein, and 15 to 25 % fat. Balance also means eating a variety of foods to make sure you are taking in enough minerals and vitamins. Ski mountaineer Greg Hill tries to have a balance of colors in his meals.
Fresh is best
One thing that came through loud and clear from all our athletes and experts is the importance of eating fresh foods. For Emelie Forsberg and Lucy Bartholomew this means preferably straight out of the earth. As an avid gardener and farmer, Emelie grows and harvests much of what she eats. Lucy, ski mountaineer Greg Hill, Mel and Ryan all try to avoid eating packaged foods, instead choosing foods that are as close to the source of production as possible.
Whole is the goal
Should go without saying: avoid processed food and food with refined sugar. Instead, all our athletes opt for whole foods. Ryan Sandes questioned the idea that recovery shakes could ever replace the nutritional value of whole food. Don't take shortcuts; take the time to eat well. It’s self kindness.
Enjoy yourself
Emelie, Ryan and Greg all said they don’t get uptight about food. Emelie has a relaxed and intuitive approach to food, and Ryan and Greg are happy to allow themselves to enjoy a pizza or a burger each week. Greg cautions not to try to be perfect; aim to make the bulk of what you eat fresh and healthy. “It’s important to enjoy life as well,” Ryan says.
Click below to read articles in our Fuelling the Engine series:
Fuelling the engine: talking nutrition with Lucy Bartholomew
Fuelling the engine: talking nutrition with Emelie Forsberg
Fuelling the engine: a commonsense approach to nutrition
Fuelling the engine: talking nutrition with Ryan Sandes
Fuelling the engine: talking nutrition with Ultracycling Man
Fuelling the engine: talking nutrition with Mel Hauschildt
D.I.E.T (disaster imminent every time), and three unchanging principles of nutrition for athletes
Fuelling the engine: talking nutrition with Greg Hill
Lead images:
Photo by ja ma on Unsplash
© Craig Kolesky / Red Bull Content Pool

Fuelling the engine: talking nutrition with Greg Hill
Record-breaking ski mountaineer, adventurer and Suunto ambassador Greg Hill has always been a foodie. Eating well is about enjoyment, which also serves his nutritional needs. He approaches it in that order, not vice versa.
“Nutrition has always been important but more so because I really enjoy eating great food,” he explains. “Yet I also understand that the fuel we put in our bodies determines how well it runs. Much like an engine, if you put bad gas into it, it will run poorly.”
Photo by Angela Percival/ Arcteryx
Fresh colors
Greg tries to eat fresh vegetables with a variety of colors, which he says indicates nutritional richness. Whenever possible, he also cooks with food from local sources. “I do grow a small garden every year, with tomatoes, potatoes, garlic, carrots, broccoli, beets, just your basics,” he says. “It’s so nice to go and grab them directly from my yard.”
Week day diet
Greg and his family are following the “week day vegetarian diet”, meaning they only meat on the weekends. This contributes to personal health and reduces their impact on the planet. “The personal health side is pretty clear, there are so many articles about reducing red meat in your diet and the benefits involved, from a reduced potential for cancer to lower cholesterol, to living longer,” he says.
“One of the simplest way to decrease my family’s carbon footprint was to decrease our meat intake; livestock farming is responsible for 20-50 per cent of the greenhouse gases, so this was an easy way to become better earth dwellers. If you ever look into livestock it is amazing the deforestation involved, the extreme water usage and over un-sustainability of it.
Photo by Angela Percival/ Arcteryx
Healthy balance
While the Hills like to keep it fresh, they also allow themselves to indulge in a fast food meal once a week, like ordering a pizza on Friday movie night. Perfection is not the goal, Greg says, just as long as the the bulk of their diet is fresh, healthy food.
“Like every family we have certain meals that are staples, enchiladas, lasagna, salad rolls, pad thai, pizza on friday nights, and my favourite – the glory bowl,” he says.
Tofu glory bowl
In the bowl
2 cups cooked brown rice1/2 cup grated beetroot1/2 cup grated carrots1/2 cups almonds, toasted1/2 cups spinach leaves1 cup tofu, cubed
Dressing
1/4 cup tahini1/4 cup apple cider vinegar1/2 cup nutritional yeast flakes2 gloves garlic3 tablespoons tamari1 tablespoon maple syrup1/4 cup olive oil1/4 cup water
Instructions
Prepare the brown rice and set aside.Fry tofu cubes in a pan.Add dressing ingredients into a blender to prepare the dressing. Add oil in a steady stream. Taste, and thin with water if required.Assemble the bowls by placing cooked brown rice into two bowls, top with beets, carrots, spinach leaves, almonds and fried tofu cubes.Drizzle bowls with dressing.
Lead image: Photo by Fancycrave on Unsplash.
Click below to read articles in our Fuelling the Engine series:
Fuelling the engine: talking nutrition with Lucy Bartholomew
Fuelling the engine: talking nutrition with Emelie Forsberg
Fuelling the engine: a commonsense approach to nutrition
Fuelling the engine: talking nutrition with Ryan Sandes
Fuelling the engine: talking nutrition with Ultracycling Man
Fuelling the engine: talking nutrition with Mel Hauschildt
D.I.E.T (disaster imminent every time), and three unchanging principles of nutrition for athletes
Follow Red Bull X-Alps 2019 live here!
And they're off! The ninth edition of the world's toughest adventure race, Red Bull X-Alps, has begun! After months of training and preparations, 32 athletes from 20 nations have set off from historic Mozartplatz in Salzburg, Austria, beginning a 1138 km race across the European Alps to the finisher's float in Monaco.
Fans around the world are getting comfortable and locking into the action. Anyone who has followed the previous editions of the race via its state-of-the-art live tracking system knows once you start watching it's difficult to stop; the drama, the obstacles, set backs, competition and break throughs make it almost addictive.
Red Bull X-Alps is a one of a kind race. If it's new to you, you might assume that because it involves paragliding it can't be too tough. Think again. This isn't sunny Saturday afternoon paragliding – it's alpine paragliding; it involves navigating huge mountain chains, glaciers, commericial flight paths. For this reason, only the very best pilots can enter the race.
It also demands next level endurance. The athletes are attempting to hike and fly across the length and breadth of the Alps, checking in at 13 turnpoints along the way. If the weather folds, they will have to hike insane daily distances with massive vertical gain. Each one of them will depend on seasoned outdoor skills.
The live tracking system makes it easy for fans to follow their favorite athletes. With many of the athletes coming from alpine nations, local fans will come out and cheer them on as they pass through their towns and villages. With this edition's route being considered the toughest race yet, this is one race worth tuning into.
Lead image by zooom.at/Red Bull Content Pool
READ MORE
THE SHEER AUDACITY OF RED BULL X-ALPS
CHASING THE EAGLE ACROSS THE ALPS

7 principles to help you find the flow
If there’s one way to get athletes talking, it’s to ask them about their flow experiences. They sit up, smile, and recall incredibly vivid experiences they will cherish for the rest of the lives. In many ways, flow states are the big reward that keep us going. Kind of like the panoramic view at the top of a mountain that makes the arduous climb worthwhile.
Flow states are a basic human potential. They are available to all of us, not only elite athletes, musicians and artists. With a little knowledge, dedication and practice, we can increase the likelihood of having a flow state experience.
According to mental coach Markus Arvaja, flow states are thoroughly immersive experiences. In his work with top ice hockey, football and tennis players, he tries to put in place the conditions that make flow states, when performance becomes almost effortless, more likely. Markus is a certified sports psychology consultant and senior lecturer in coaching at Finland’s Haaga-Helia University of Applied Sciences.
Click here to read our article explaining the science flow states!
No challenge, no flow
“First,” Markus says, “you need to have a feeling of being challenged, but that you have the competency and self confidence to handle it.” It’s a delicate balance. If the challenge is too great, and you feel out of your depth, lacking the skills for an activity, then it’s unlikely you will experience a flow state. There’s simply too much mental activity happening.
On the other hand, if the task is too easy, and the challenge is too low, then you are likely to be bored, also making flow state unlikely. The sweet spot is somewhere in the middle. So consider what might be a reasonable challenge for you, one that you feel confident in your skills and ability to take on.
Feel positive
The next essential condition for flow state experiences is motivation. “It helps if you can achieve your optimal arousal,” Markus explains. “You need to feel that you are really into the activity.” There’s another balance here. One extreme is boredom, the other is being too excited, almost nervous with anticipation. In the middle is relaxed enthusiasm. One way to achieve this is to remember the reasons you love your sport, what it gives you, a few minutes before you perform. Or maybe listening to music motivates you.
Automate the skill set
The reason top athletes and musicians experience flow is because they have put in the countless hours necessary to master their chosen activities. Whatever your sport, you need to have automated the skills required to experience flow. The action should come naturally from the body without any need for thinking or assesment. “If you don’t trust your technique, it’s hard to achieve the flow,” Markus says. “It’s important you train so much that you are well prepared and can get let go and let it happen. The moment you start to think too much, it’s hard to be in the flow.”
One thought at a time
Did we mention that thinking too much might obstruct a flow state? In the mindfulness movement, teachers talk about the “monkey mind”. Like we often jump from one thought to another, a monkey jumps from branch to branch incessantly. Constant thinking is tiring and distracting. “One good thing to do is to shift your focus to the activity at hand,” Markus says. “For example, if you are a tennis player, you could totally concentrate on moving your feet. It helps to concentrate on one or two things only. If you can do that, you might start to notice the flow. Just play the game and enjoy!”
Have a plan
Having a plan is very helpful, Markus says. For example, if you’re going to run a trail race, the plan might include having your own guidelines for pace, fuelling and heart rate. Well before the race, you might study the course, even train on it to get familiar, so on race day you know when to push and when to take it easy. “Make a plan at home,” Markus says. “That’s what we do in team sports. The less you think on the day, the better you perform.”
Practice mindfulness
“Mindfulness certainly helps,” Markus says. “If your mind is free of worry, and unnecessary thoughts, you can stay in the present moment. It’s good to learn to quiet the mind, to turn off the inner critic. Learn to simplify and focus on one thing.”
Play!
Yes, it’s important to have goals, to have a plan, to automate skills, and to be motivated. But if we get too serious, we risk getting too severe with ourselves and then the sport we once loved can feel like a strain. “Just play!” Markus always tells his clients. “It helps when you are positive and having fun. You can’t force the flow!”


The sheer audacity of Red Bull X-Alps
Race organizer Ulrich Grill explains the 2019 route at a press conference. © zooom.at / Red Bull Content Pool
When the race organizers of Red Bull X-Alps announced the 1138 km route for the ninth edition of the race, many athletes felt it is the most challenging yet. Race veteran Paul Guschlbauer, for example, said crossing the Alps from Germany to Italy, while facing strong winds, will demand every bit of his skill and strength.
“We still have so much snow in the Alps and there’s only four weeks to go,” Paul says. “It was snowing down in the city a couple of days ago, and we have to go up to 2500 m, crossing it by foot if we can’t fly. When there is so much snow in the high mountains the thermal uplifts we need to fly don’t develop. It could be tricky up there!”
Click here to read about Paul and his quest to catch the Eagle!
There are only 1138 Suunto 9 Baro Red Bull X-Alps Limited Edition pieces. One for every kilometer of the race!
The Red Bull X-Alps is an adventure race unlike any other. In the 2019 edition of the race, starting June 16, 32 athletes from 20 nations around the world will attempt to hike and fly across the length and breadth of the Alps, checking in at 13 turnpoints along the way. If the weather doesn’t play ball, they must hike insane daily distances with massive vertical gain.
With nearly double the number of turnpoints than in previous editions, and five zigzag crossings of the Alps, the athletes are going to be pushed to their ultimate potential. And fans are in for a treat.
For adventure sports fans, this race is almost addictive to follow. The live tracking system allows fans to follow their favourite athletes in real time. The race crosses through five alpine nations – Austria, Germany, Italy, Switzerland and France – and whole villages come out and cheer the athletes as soon as they see via live tracking they are passing through.
To give you a sense of the sheer audacity and scale of this race, here’s a preview of the route!
Salzburg to Gaisberg
Distance covered: 5 km
It’s race tradition to start in Mozartplatz in Salzburg, Austria, surrounded by the classical and natural beauty of this historic alpine city. The first turnpoint is only five kilometers away, but don’t let that fool you. Athletes must race up Gaisberg (1288 m) carrying their paragliding packs. It’s important athletes pace themselves well here, and catch a good thermal to carry them onwards. Every race, fans assemble at the top of Gaisberg and wait for the athletes to cheer them on.
Gaisberg to Wagrain-Kleinarl
Distance covered: 59 km
It might not seem like a long way, but remember the numbers alone don’t show the skill and precision this race demands. In this section, the athletes must navigate through a small flight path across a mountain range, while avoiding the Salzburg airport restricted airzone. At most turnpoints, athletes must sign their names on a signboard. The second turnpoint signboard is located right in town.
Wagrain-Kleinarl to Aschau
Distance covered: 148 km
One a clear day some of the best competitors might reach this third turnpoint in Aschau (615 m), Germany on the first day. Most will reach it on the second, after crossing the Hochkonig mountain group. Consider this leg the quiet before the storm; next they must make their first crossing of the Alps, from Germany south to Italy.
Aschau to Kronplatz
Distance covered: 268 km
Snow covered peaks, glaciers, the Italian Dolomites, fierce winds all put the pressure on in this leg. The fourth turnpoint is located at the top of Kronplatz, a 2275 m mountain, making careful flying incredibly important. Misjudge, and the athletes might land in a valley, and have to slog up to the top.
Land in the wrong place, and athletes have to hike to a launch spot. © Felix Woelk / Red Bull Content Pool
Kronplatz to Lermoos-Tiroler Zugspitz Arena
Distance covered: 381 km
After one epic crossing of the Alps, athletes must turn back, and cross north again. Strong northern winds are common, making for challenging flying. Adding to the challenge is the restricted airspace zone around Innsbruck, Austria, requiring a diversion north into Germany. The fifth turnpoint is reachable only after circumnavigating Zugspitze (2962 m), Germany’s highest peak!
Lermoos-Tiroler Zugspitz Arena to Davos
Distance covered: 483 km
The meeting place of the world’s tremendously wealthy, Davos, Switzerland, gets tremendously exciting as the athletes fly through, landing by the lake to sign the sixth turnpoint signboard. From this point on, the weather begins to play an even bigger role.
Red Bull X-Alps demands precision piloting. © Felix Woelk / Red Bull Content Pool
Davos to Titlis
Distance covered: 592 km
Bad weather is every athlete’s worst nightmare in this leg. Unflyable, and they have to hike to the top of Titlis mountain (3238 km) to sign the board at the seventh turnpoint. Restrictions put in place by the race organizers make accessing the top even more challenging. There is only one village that athletes are permitted to climb to the summit by foot from. And that village is way off course from the most efficient flight path.
Titlis to Eiger
Distance covered: 630 km
Famous for its intimidating north faces, Eiger (3970 m) is an icon of European alpinism. The good news for the athletes is there is no turnpoint to sign in at on the summit! Instead, they must prove they passed within a 1500 m radius of the virtual cylinder.
Eiger to Mont Blanc
Distance covered: 751 km
In this leg, athletes must travel north from Switzerland into France, past Europe’s highest peak, Mont Blanc (4810 m). Like the previous leg, there is no signboard at the summit. Instead, they must traverse the northern side, keeping the mountain at their left.
Mont Blanc to St. Hilaire
Distance covered: 847 km
One of the paragliding meccas of Europe, St. Hilaire in France offers easy take off conditions. The athletes can sail in quickly and sign the board at turnpoint 10, before launching again and setting off to cross the Alps again!
Paul Guschlbauer power hikes to his next take off spot during Red Bull X-Alps 2017. © Sebastian Marko / Red Bull Content Pool
St. Hilaire to Monte Viso
Distance covered: 965 km
Crossing from the north to the south-east, athletes head to Italy’s Monte Viso (3841 m), where they must again prove by GPS tracking that they passed through a 2250 m virtual cylinder. While not as famous as previous peaks, race organizers say turnpoint 11 might be the toughest because of the mountains and valleys athletes must navigate through to get there.
Monte Viso to Cheval Blanc
Distance covered: 1045 km
This is a new, unexplored area to Red Bull X-Alps. By this point, the remaining athletes that haven’t dropped out will be exhausted. Cheval Blanc, a 2323 m peak in the French Alps, will be one of their last obstacles to navigate past. This time, they are required to pass on the west, either by foot or wing.
Cheval Blanc to Peille
Distance covered: 1136 km
Here, at last, the clock stops. The ceremonial end is 2 km below on a float on the shore of Monaco. The Peille turnpoint (13) is located at a mere 709 m, a pimp squeak compared to the massive peaks the athletes have already endured. However, it’s small size is deceiving; because of the many hills preceding it, it’s all too easy to pick a bad thermal and wind up landing, and being forced to continue on by foot, losing precious time.
Peille to Monaco
Distance covered: 1138 km
The landing float in the glistening Mediterranean Sea will be sight for the tired eyes of the courageous athletes that made it through the gauntlet. It’s time to pop the champagne!
Red Bull X-Alps 2019 begins on June 16. Stay tuned for more of the action!
Lead image: © Felix Woelk / Red Bull Content Pool


