




Suunto Blog


Run with the new Suunto Run GPS watch
Every runner runs with a different goal: a faster time, a longer distance, a first marathon, or simply the habit of showing up every day. Suunto Run is built to support them all, with the essentials you need on your wrist.
Light, precise, and focused on running, Suunto Run brings the key tools for training, racing, and everyday progress into one watch. Here is how to use Suunto Run, plus 10 features that help make every run more purposeful.
What Is Suunto Run? Key Specs and Features
Suunto Run is a GPS sports watch developed by SUUNTO for runners. It is made for the moments that matter on the road, track, and trail: holding pace, staying light, reading data quickly, and trusting your watch from start to finish.
Key specs of Suunto Run:
Weight: Just 36 g, among the lightest watches in SUUNTO history
Battery: Up to 12 days in daily use and up to 20 hours in training mode
Display: Bright, high-resolution AMOLED screen with crown operation support
GPS: High-precision pace and distance tracking with dual-band GNSS
Sport modes: 34 sport modes, centered on running
Connectivity: Syncs with the Suunto app, Strava, Adidas Running, ASICS Runkeeper, and many other partner apps
At 36 g, the watch stays light through long runs and marathon efforts, close to the feeling of not wearing a watch at all. The textile strap fits securely and helps reduce shifting and discomfort as the kilometers add up.
View Suunto Run product details
How to Use Suunto Run: 10 Key Features
These 10 Suunto Run features are built for runners who want practical tools without extra complexity. Whether this is your first GPS watch or your next race-day companion, they are ready to use from the start.
1. Interval Run: Watch-Guided Structured Training
Interval training builds speed and endurance through focused bursts of effort and recovery. Create your interval session in the Suunto app before the run, and Suunto Run guides the full workout from warmup to final repeat.
No need to count seconds in your head or keep checking a separate timer. The watch handles the structure, so you stay with the effort, the rhythm, and the purpose of the session.
2. Ghost Runner: Pace Control with a Virtual Pacer
Ghost Runner gives you a virtual pacer set to your target pace. On the watch, you see your real-time gap to that target, whether you are pulling ahead or slipping behind.
On race day, that feedback helps you hold back when the first kilometers feel too easy. During long runs, it keeps easy days controlled and steady. The result is clearer pacing, better discipline, and more confidence when it is time to push.
3. Marathon Time Prediction: See Your Finish Time as You Run
In a marathon, pace can feel different at 30 km than it did at 10 km. Marathon time prediction shows your estimated finish time based on your current pace, so you understand what the numbers mean while you are still moving.
When fatigue kicks in or the pace starts to fade, you see how much you need to adjust to stay close to your goal. It is a practical tool for first-time marathoners and runners chasing targets such as sub-4 or sub-3.5.
4. Voice Feedback and Lap Function: Hear Your Lap Data in Real Time
Turn on Auto Lap, choose your distance, and Suunto Run records each split automatically. Pace, heart rate, and time appear on the watch for every section, whether you prefer checking every 1 km or every 5 km.
Pair the watch with Suunto Spark, SUUNTO's open-ear headphones, and those lap updates become real-time voice feedback. Your eyes stay forward. Your hands stay relaxed. Manual laps are also available for marking turnarounds, aid stations, or any point that matters in your run.
5. Metronome: Hold Your Target Cadence
Cadence, or steps per minute, is one of the clearest signals of running efficiency. A cadence around 180 spm is often used as a reference point, and Suunto Run's metronome helps you stay close to your target.
The watch vibrates at a steady rhythm, giving your stride a simple cue to follow. In the later kilometers, when form starts to loosen, that rhythm helps bring your turnover back into focus.
6. Hydration Reminder: Stay Ahead of Dehydration and Energy Drops
On hot days and long-distance efforts, hydration and fueling often fall behind before you notice. Set reminders in advance on Suunto Run, and the watch prompts you at regular intervals.
Use it to keep your race-day aid station plan on track or to manage nutrition during long training runs. Small reminders at the right time can help protect performance in the final stretch.
7. Track Run Mode: Precision on the Track
Running on an athletics track can challenge standard GPS accuracy, especially when tight turns repeat lap after lap. Track Run mode uses an algorithm optimized for track environments to record accurate pace and distance data.
For speed sessions, time trials, indoor tracks, and official athletics tracks, it gives each repeat the precision it deserves.
8. Heart Rate, Recovery, and Sleep Tracking: Readiness Beyond the Run
Training does not end when the run is saved. Suunto Run tracks optical heart rate from the wrist and monitors sleep around the clock, building a clearer picture of how your body is responding.
Use the accumulated data to understand the balance between training load and recovery. Some days are made for hard efforts. Others are better spent recovering well. Suunto Run helps make that decision more informed and helps reduce the risk of overtraining.
9. Music Playback: Run with Music, Leave the Phone
Suunto Run stores MP3 files directly on the watch, so music can come with you even when your phone stays behind. It keeps race-day gear simple and training days focused.
With Suunto Spark, SUUNTO's open-ear headphones, you can listen while staying aware of traffic, surroundings, and other runners. More freedom, without closing off the world around you.
10. Running App Connectivity: Go Deeper with Strava and the Suunto App
After each run, your data syncs automatically to the Suunto app. Routes, pace graphs, heart rate trends, and long-term training volume are all ready for review when the effort is done.
Suunto Run also connects with hundreds of partner apps, including Strava, Adidas Running, MapMyRun, and ASICS Runkeeper. If you already have a favorite platform, your data moves with you and your existing routine stays intact.
Comfortable Fit: 36 g Lightness and an AMOLED Screen
Features matter. Fit matters just as much. One reason many runners choose Suunto Run is its exceptionally light construction.
At just 36 g, it sits among the lightest watches in SUUNTO's lineup. The textile strap feels soft against the skin and is designed to reduce pressure over long runs. Even through a five-hour marathon, the watch stays low-profile and easy to wear.
The high-resolution AMOLED screen keeps data clear at a glance, even in direct sunlight. Crown operation makes screen changes feel natural while you run, without breaking rhythm.
Run with Suunto Spark: A More Complete Running Experience with Suunto Run and Spark
Pair Suunto Run with Suunto Spark, SUUNTO's open-ear headphones, and the running experience becomes even more connected.
Voice feedback: Spark announces lap pace, heart rate, distance, and time, keeping your eyes forward instead of on the watch
Real-time running metrics: Spark records cadence, ground contact time, and vertical movement in real time to support more efficient running form
Open-ear music: Hear approaching cars, bicycles, and running partners while enjoying music without blocking your ears
IP55 dust and water resistance: Built for confidence in rainy conditions and sweaty training sessions
Up to 36 hours of battery life: With the charging case included, Spark has enough battery for marathons and long-distance training
Suunto Run and Suunto Spark are designed to work together as part of the SUUNTO ecosystem. The watch tracks the data, the headphones deliver feedback, and the whole run stays easier to manage from start to finish.
View Suunto Spark details
Suunto Run and the Suunto App: Analyze Your Running with Data
The value of Suunto Run continues after the run. Post-run data shows what changed, what worked, and where the next step may be.
In the Suunto app, you can check and manage:
Route maps: Review your running route on a map and look back at course details
Pace and heart rate graphs: See how intensity changed across each section
Training load and recovery: Check scores that show the balance between accumulated fatigue and recovery
Long-term trends: Track running distance and activity volume by week or month
Sleep data: Understand how sleep quality and quantity affect your training condition
Over time, the data reveals your patterns: how you respond to hard sessions, where your strongest pace ranges sit, and when recovery needs more attention. Suunto Run becomes more than a timer. It becomes a training partner for better decisions.
Summary
Suunto Run is a GPS sports watch for runners of every level, from people starting their running journey with SUUNTO to dedicated marathoners chasing their next goal.
To recap the 10 Suunto Run features introduced here:
Interval Run, Ghost Runner, marathon time prediction, voice feedback and lap functions, metronome, hydration reminders, Track Run mode, heart rate, recovery and sleep tracking, music playback, and running app connectivity are all built into a lightweight 36 g body.
Pair it with Suunto Spark, and the SUUNTO ecosystem supports voice feedback, cadence insights, and safer music running in one connected experience.
Whatever your reason for running, Suunto Run is built to move with you.
View the Suunto Run product page
Upgrade your run with Suunto Spark
Suunto Run features and specifications are subject to change without notice. Please check the official product page for the latest information.


Why do we run?
What drives someone to run at 6AM through frosty streets, while another takes on a 50K mountain ultra? Why do we run? As Dr. Neil Baxter shows, the answers are far from simple.
Dr. Neil Baxter is a social scientist with a passion for running – not just as a sport, but as a cultural phenomenon. After a five-year research project into British running culture at the University of Warwick, his insights were published in a book on the subject. In a recent talk, he unraveled the complex web of motivations that drive people to run – and how those reasons have changed dramatically over the past century.
From the track to the trail: How running has changed
If you were to picture a runner in the 1950s, chances are you’d imagine a young, white male – perhaps a university athlete, chasing track records with serious intent. Running, back then, was largely the domain of the competitive few. Recreational joggers, when they began appearing in suburban America in the 1960s, were so unfamiliar that some were stopped by police. Society didn’t quite know what to make of people running slowly down the street without the clear goal of a finish line.
Today, that narrow image of the runner has exploded into a kaleidoscope of diversity. We now associate running with people of all backgrounds and body types. We run on city streets, park trails, forest paths. Some chase personal bests, some run for mental clarity, others to raise funds for charity – or simply to feel alive in nature.
Health crises, spiritual highs, and social status: The motivations over time
The initial running boom in 1960s America was largely a response to rising health concerns, especially heart disease linked to sedentary lifestyles. When jogging entered the public consciousness – thanks in part to Nike co-founder Bill Bowerman’s efforts – it promised a way to take back control of one’s well-being. But running didn't just become a solution for physical health; it soon acquired a deeper meaning.
By the 1970s, running had woven itself into the counterculture, with books like The Zen of Running casting it as a spiritual practice. The “runner’s high” was seen not only as a chemical rush but as a transcendent experience – “a flowering of new colours in the soul,” as one writer put it.
At the same time, running was adopted by the rising class of ambitious professionals. It became a symbol of individual discipline, self-reliance, and success – ideals that aligned with emerging neoliberal values. For some, running marked them as part of a new physical elite.
The marathon emerged as the ultimate badge of achievement during the 1980s, with participation skyrocketing – especially among male executives seeking a controlled but intense test of toughness. Women, meanwhile, were still being excluded from many of these spaces: the Olympic women’s marathon wasn’t held until 1984.
That changed in the early 2000s. A new wave of participation – this time led by women – reshaped running yet again. More inclusive events and broader motivations came into play: fun runs, charity races, color dashes, and community events attracted people who were less driven by competition and more by social connection, physical health, and joy.
As marathons became more accessible, some competitive runners shifted toward more extreme formats – like ultramarathons and mountain races. These forms of running, according to Neil’s research, are still disproportionately populated by the same higher-income, male demographic that dominated marathons in earlier decades. Running, even in its most rugged forms, remained a stage for expressing identity, values, and even social class.
So why do you run?
Neil Baxter’s data underscores what many of us feel instinctively: there’s no single reason people run – there are many, often overlapping ones.
Most runners, according to his survey, cited general fitness and emotional well-being as key motivators. Fewer than a quarter said competition was a very important driver. Gender and age also played a role: men were more likely to cite competition and speed, while women prioritized physical and mental health. Interestingly, older runners – especially those over 70 – saw an uptick in social motivations and community connection.
Motivations also shift based on the type of running. Track athletes skew competitive and social, while hill and trail runners are drawn to nature. Joggers (non-competitive runners) emphasize physical appearance, and obstacle course racers often cite charitable fundraising.
The many faces – and reasons – of running
From elite track athletes to casual joggers, from urban commuters to ultrarunners in remote wilderness, running has become a multifaceted activity with room for everyone. Its meaning is no longer confined to podiums or personal records.
As Neil Baxter puts it, “Many ideas, meanings, or forms of significance have been attached to the simple act of putting one foot in front of the other.” Running is now as diverse as the people who do it – and as complex as the lives they lead.
Whether you run to compete, to clear your mind, to feel strong, or to be part of something bigger, your reason is valid. And just like the sport itself, your reason can change – evolve – over time.
Because in the end, we all have our own pace, path, and purpose. Simply put: run your own story.


Trail Alsace Grand Est by UTMB
The trail running season has started and we are happy to attend the Trail Alsace Grand Est by UTMB, May 15 to 18.
We are ready, and you?
Last year's edition brought together 6,000 runners from 60 nationalities, who uncovered a landscape rich in historical and cultural Alsatian heritage. Competitors experienced a spectacular start with medieval flair, accompanied by the gallop of knights in armor. This dramatic beginning set the stage for an unforgettable journey, including stops at many fortified castles such as the Château du Haut-Koenigsbourg, the picturesque towns of Turckheim and Kaysersberg, and the scenic beauty of the famous Alsatian vineyards. Each step revealed a new layer of the region's remarkable history and breathtaking scenery.
Suunto will be present at the race village with a booth, where our team will be happy to share the latest brand news, showcase our products, and support you before your race.
But that's not all—take part in the COMMUNITY RUN, in collaboration with PWRUP. Experience the thrill of running 6 km through the stunning hills of Obernai and relax afterward with a snack to refuel.
Community Run – Friday, May 16🕑 14:00 – Departure from the Suunto booth🏃 6 km route through the hills of Obernai🕒 ~15:00 – Return to Suunto booth🍫 Post-run snack with Näak products and soft drinks Register now and book a unique opportunity to test one of our sports watches during the run!
👉 REGISTER!
Can’t join the community run but still want to try a watch? No problem—just stop by our booth and ask to borrow one for 1 hour, 2 hours, or more. Our team will find a solution for you!

Over 50 events, 1 passion: Your guide to the 2025 UTMB World Series
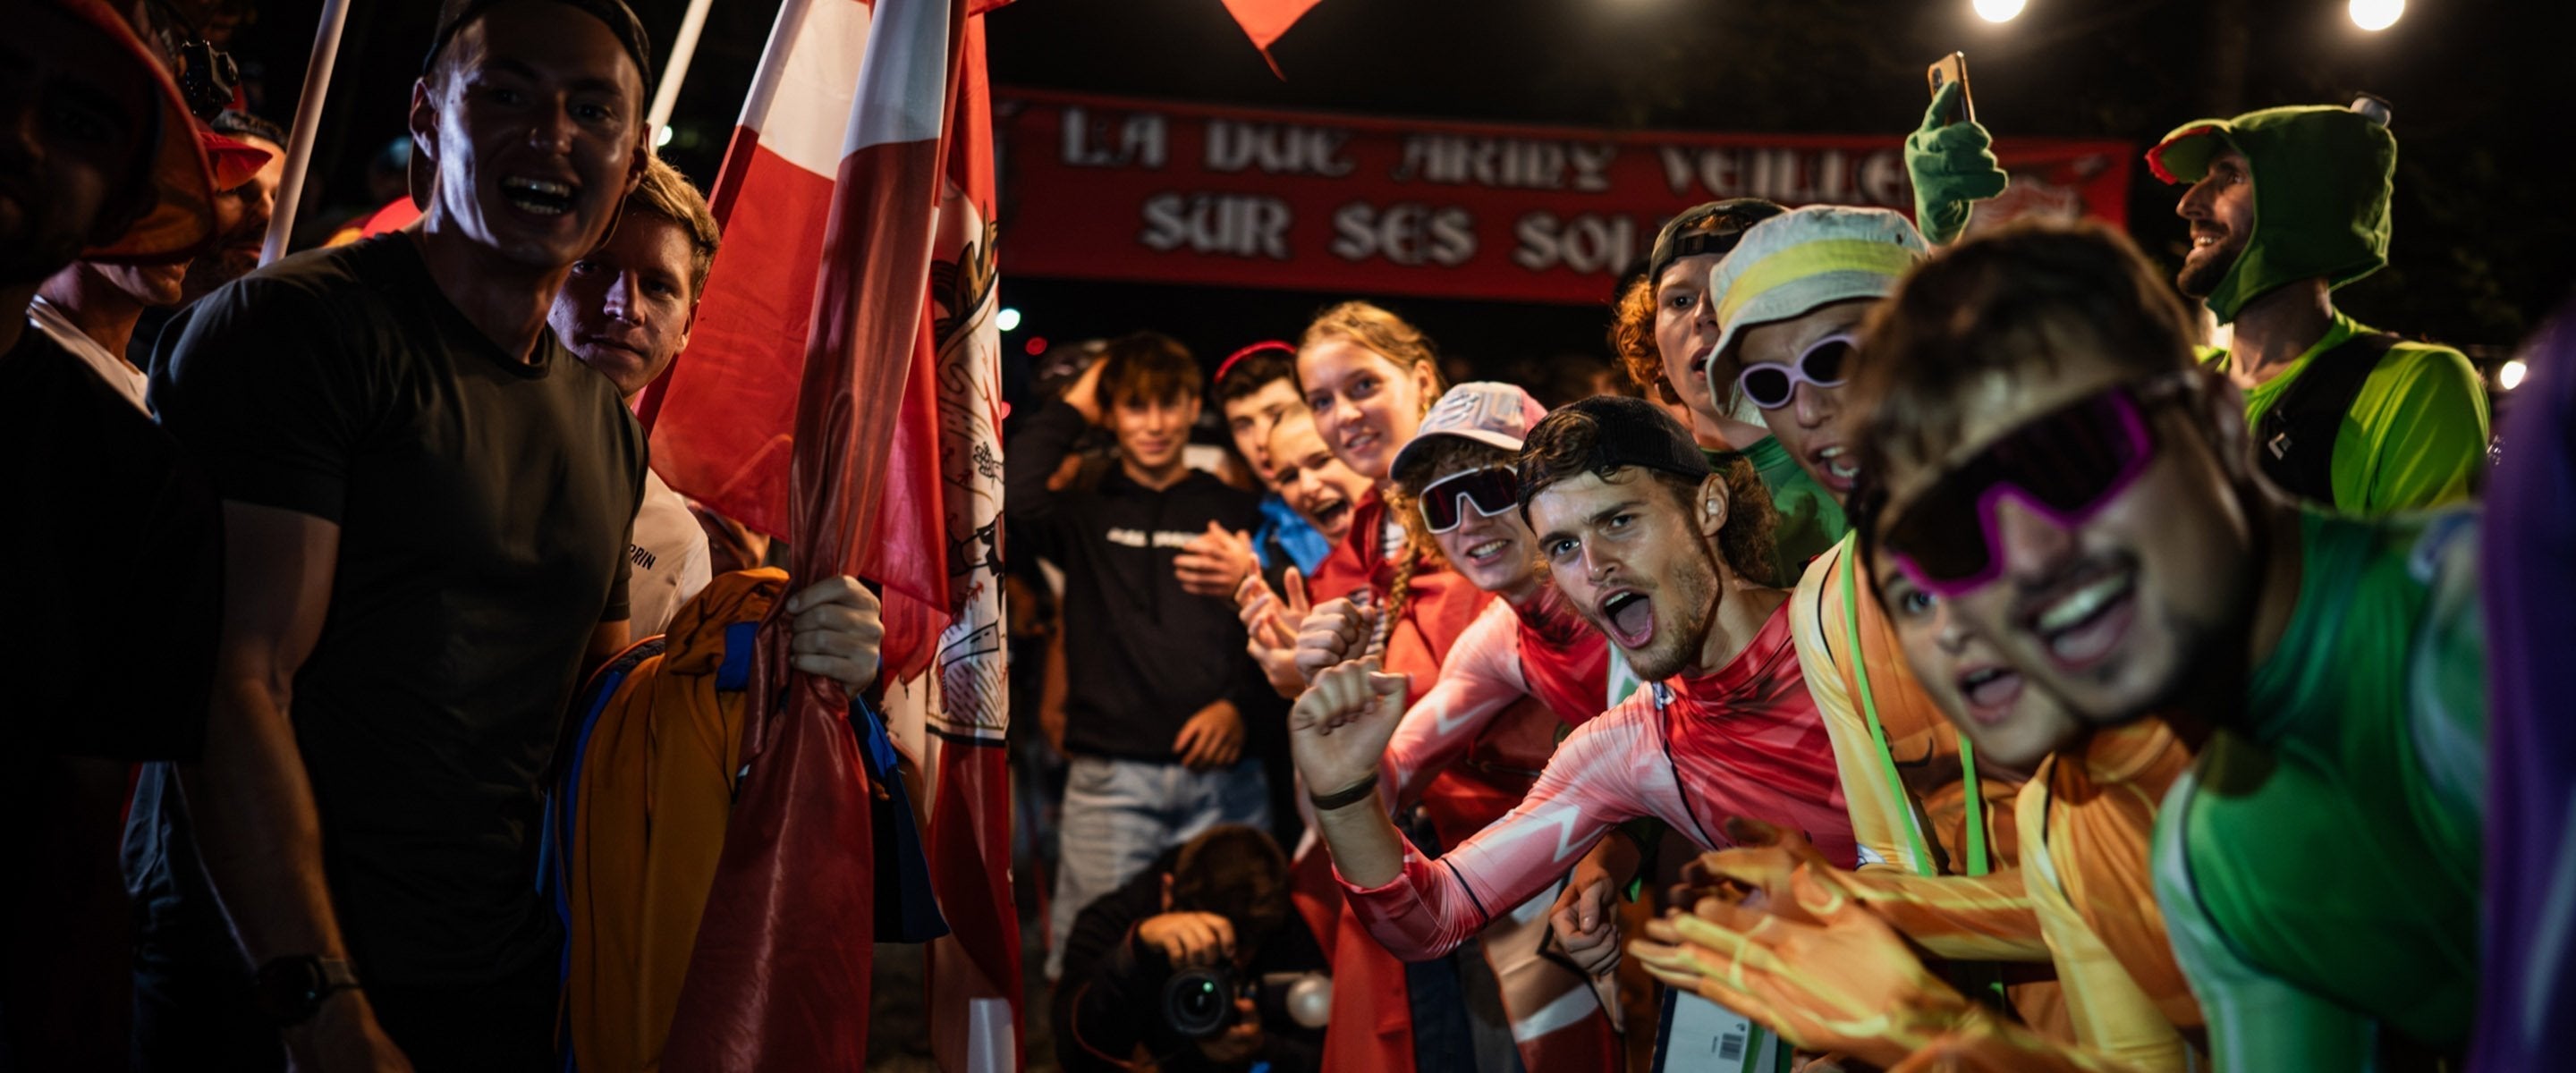
The 2025 UTMB World Series is more exciting than ever with new destinations, the legendary challenges, and Suunto supporting athletes and fans alike.
The trail running world is set for another epic year as the 2025 UTMB World Series expands to over 50 events across 28 countries and five continents, bringing the spirit of adventure and community to runners everywhere.
As an official partner of the UTMB World Series, Suunto is proud to be on-site at most of these events, supporting athletes, showcasing our latest products, and inviting the community to join shake-out runs in the lead-up to race day. Whether you're toeing the start line, cheering from home, or meeting us at the expo, we’ll be there to share the journey.
From iconic landscapes to new territories, here’s what’s ahead in the 2025 season.
Eleven new events
The 2025 calendar introduces eleven exciting new races, expanding the series into new regions and offering runners even more ways to connect with the global trail scene. From windswept Cornish coastlines to the remote Chilean wilderness, these events bring fresh terrain and culture to the series.
Here’s the full list of new races joining the series:
Europe
Arc of Attrition (UK) – Jan 24–26Grand Raid Ventoux (France) – Apr 25–27Monte Rosa Walser Waeg (Italy) – Jul 18–20Kaçkar (Türkiye) – Sep 26–28Puglia (Italy) – Nov 7–9
Asia
Ultra-Trail Xiamen (China) – Mar 1–2Ultra-Trail Great Wall (China) – May 16–18Kaga Spa Trail Endurance 100 (Japan) – Jun 19–22
South America
Torrencial Chile – Jun 19–21Chihuahua (Mexico) – Oct 2–4Patagonia Bariloche (Argentina) – Nov 18–22
See the full 2025 UTMB World Series race calendar here.
Four majors, four chances to double your Stones
The UTMB World Series Majors are the pinnacle events of the season on each continent. These are the only races where athletes can double their Running Stones, increasing their chances of qualifying for the UTMB World Series Finals in Chamonix.
Running Stones are the official currency of the UTMB World Series qualification system. Runners earn them by finishing UTMB World Series races. The more Running Stones a runner collects, the more chances they have in the lottery to enter the UTMB World Series Finals in Chamonix.
In 2025, the Majors are:
Oceania Major: Ultra-Trail Australia – May 15–18
Europe Major: Val d'Aran – July 2–6
America Major: Kodiak Ultra Marathons – October 10–11
Asia–Pacific Major: Chiang Mai Thailand – December 5–8
All roads lead to the finals in Chamonix
The UTMB World Series season culminates in one extraordinary week in Chamonix, France, where the UTMB World Series Finals take place from August 25–31, 2025.
The three Finals are:
OCC (50K)
CCC (100K)
UTMB (100M)
Alongside these Finals, other events like the TDS, MCC, ETC, YCC, and the legendary PTL will fill the week with unforgettable moments, camaraderie, and trail running excellence.
Watch the season unfold live
Want to follow the drama as it happens? 12 races will be broadcast live in 2025 through UTMB Live. The UTMB Live season already started with the live streams of Chianti Ultra Trail and Tenerife Bluetrail in March.
Up-coming livestreamed races include:
Ultra-Trail Australia (Oceania Major)
Val D'Aran
Trail Verbier St-Bernard
Monte Rosa Walserwaeg
Eiger Ultra Trail
UTMB Mont Blanc (Finals)
Wildstrubel
Nice Côte d'Azur
Kodiak Ultra Marathons (America Major)
Chiang Mai Thailand (Asia–Pacific Major)
With coverage in multiple languages, drone footage, runner-mounted cams, expert commentary, live stats, and behind-the-scenes interviews, UTMB Live offers an immersive way to experience the races no matter where you are.
Even when races aren’t livestreamed, you can still follow the action in real time on live.utmb.world. The platform provides GPS tracking and real-time leaderboards optimized for mobile so you can check in from anywhere.
Suunto: Your partner on the trail
In 2025, we’ll be right there with you at most of the events – cheering you on at race expos, running side by side at shake-outs, and celebrating your finishes.
See you on the trails!
Read more
Pace your race with Abby, Iris and Dakota
Learn from your run with Hannes Namberger
Ultra running mantras: Mental fuel for the long haul

Suunto Vertical Week 2025 reached new heights!
The 11th annual Suunto Vertical Week was bigger than ever, bringing the community together for an epic challenge. Now, the results are in – see who climbed to the top!
From March 3–9, we challenged you to rack up as many vertical meters as possible. Once again, we set out to determine which nation and which activity type climbed the most. The data from the Suunto app is in – here are the results!
This year, you also had the chance to participate on Strava and support Protect Our Winters through the Vertical Week Strava Challenge. Our goal was to reach 1 million vertical meters, but you crushed that target – 121 times over!
We pledged to donate €1 for every 100 meters climbed to Protect Our Winters Europe, up to a limit of 1 million meters, to support their vital work in fighting climate change. Your passion exceeded all expectations – amazing!
Familiar names dominated the country rankings
In the country rankings for the average ascent per session, the usual suspects – nations in Europe’s mountainous regions – once again came out on top. Austria reclaimed the number one spot from Italy, while Switzerland held onto third place.
Average ascent per session by country
Austria – 399m
Italy – 392m
Switzerland – 373m
Slovenia – 346m
Slovakia – 305m
Spain – 273m
France – 271m
Germany – 230m
Czech Republic – 221m
Croatia – 214m
When looking at total ascent from all participants, France secured the top spot, followed by Spain and Italy.
Total ascent by country
France
Spain
Italy
Germany
Austria
Switzerland
Poland
USA
Slovenia
United Kingdom
On an individual level, ten participants climbed over 14,000 meters in a week – averaging more than 2,000 meters per day. Well done!
To make the top 10%, you needed to climb 2,200 meters – 75 meters less than last year but still 300 meters more than in 2023.
For the top 3%, the benchmark was 3,958 meters – 104 meters less than last year but 368 meters more than two years ago.
Ski tourers lead the way
As in previous years, ski tourers dominated. Ski touring was the only activity type where the top three countries averaged over 1,000 meters per session. The overall ski touring average was an impressive 947 meters.
However, when looking at the total number of big '1000-meter days', trail runners recorded the most this time.
The only country with more than one win in the activity type rankings was South Africa: They dominated both the mountain biking and cycling rankings. Congrats!
Ski touring
Austria – 1,044m
Switzerland – 1,036m
France – 1,005m
(All ski touring activities average per session: 947m)
Austria claimed the top spot, dethroning Slovakia, while France moved up to third. The 1000-meter mark remains a clear goal for skiers, with the entire top three surpassing it once again. Germany and Italy followed closely at 987 and 971 meters, respectively.
Mountaineering
France – 968m
Austria – 761m
Italy – 750m
(All mountaineering activities average per session: 633m)
France took a strong category win in mountaineering, with the average ascent for all mountaineering activities remaining exactly the same as last year! (Edit: The top 3 was corrected on March 14 due to an error on our dashboard.)
Trail running
Japan – 805m
Italy – 652m
Portugal – 592m
(All trail running activities average per session: 444m)
Japan continued to lead, though their average was lower than last year – perhaps due to deep powpow this winter?
Mountain biking
South Africa – 490m
Spain – 346m
Slovenia – 297m
(All moutain biking activities average per session: 368m)
South Africa maintained its top position despite a drop in its average from 645m to 490m. Is the country getting ready for the upcoming Cape Epic or what do these strong performances in the MTB rankings tell?
Gravel cycling
Czech Republic – 524m
Switzerland – 505m
Spain – 422m
(All gravel cycling activities average per session: 289m)
A full reshuffling – last year’s top three didn’t return to the podium this year! Is this a sign of gravel cycling still evolving and growing as a sport?
Cycling
South Africa – 490m
Spain – 346m
Slovenia – 297m
(All cycling activities average per session: 172m)
Spain and Slovenia held their ranks, but South Africa stole the show with another category win. Lekker, bru!
Trekking
Spain – 628m
Slovenia – 379m
Italy – 340m
(All trekking activities average per session: 334m)
Trekking had a fresh top 3 with Spain clearly taking the win.
Hiking
Slovenia – 555m
Portugal – 529m
Spain – 496m
(All hiking activities average per session: 235m)
Slovenia delivered strong performances across multiple categories this year: number one in hiking but also top three in mountain biking, cycling, and trekking. Kapo dol!
Cross-country skiing
Italy – 340m
Czech Republic – 325m
France – 322m
(All XC skiing activities average per session: 227m)
Unlike other activities, cross-country skiing was the only one where the average ascent increased from last year.
Running
Norway – 123m
Switzerland – 122m
Belgium – 119m
(All running activities average per session: 82m)
This was the closest battle of all, with Norway edging out Switzerland by just half a meter! The average ascents in Suunto’s most popular activity type, running, are not huge but that makes the battles even more exciting!
See you next year!
Vertical Week 2025 proved once again that the Suunto community is unstoppable. Whether you were ski touring in the Alps, trail running in Japan, or cycling in South Africa, your dedication made this event one for the record books.
See you next year – until then, keep climbing!


Chianti Ultra Trail by UTMB
The trail running season is finally starting again! The first unmissable event is the Chianti Ultra Trail by UTMB, taking place from March 20 to 23.
The 2024 edition was a record-breaker, with over 3,600 participants from 72 nations and more than 10,000 visitors over the three thrilling days of races.
© Jose Miguel Munoze
What makes this event truly special is its unique setting: the Chianti hills — candidates to become a UNESCO heritage site — renowned for their stunning natural beauty, medieval villages, vineyards, and forests.
The races unfold amidst this breathtaking landscape, once again attracting athletes from around the world.
Our Suunto athletes are ready to give it their all, including Italians Andreas Reiterer — last year’s winner of the most challenging race, the Ultra Trail Chianti Castles (120 km and +5200 m of pure passion and talent) — alongside Davide Cheraz and Mattia Bertoncini. Also competing are Ugo Ferrari and Alban Berson (FR), Dominika Stelmach (POL), Tomas Farnik (Czech Republic), and Abby Hall and Ryan Montgomery (USA).
Suunto will be at the event village with a booth, where our team will be happy to share the latest brand news and showcase our products.
But that's not all — join the COMMUNITY RUN in collaboration with Näak! Experience the thrill of running 5 km through the Chianti hills and enjoy a snack at the end of your workout.
Community Run Program — Saturday, March 22
14:30: Departure from the Suunto booth
5 km route through the Chianti hills
15:30 (approx.): Arrival at the Näak booth
Post-run snack with Näak products and soft drinks
Register now and don’t miss this unique opportunity to test one of our sports watches during the run!
Sign up


