


Suunto Blog


Recover like a pro
What is the best way to recover after a race, adventure or just a hard effort on your own? We asked our ambassadors how they do it. From eating pancakes to paragliding, from secret smoothie recipes to stretching, their answers will help you get back on form more quickly.
KILIAN JORNET Stay fresh by doing other sports I like to do some mountaineering activities to feel different feelings than just running. I ran less than 200 km in the build up to Hardrock because I was climbing instead. I was keeping myself fit through mountaineering so when I came to the race I was mentally fresh and physically prepared.
Kilian stretches ©jordo canamerasAvoid over-trainingIf you focus too hard on one thing for too long you can get tired of it. You see people who are doing a lot of long races and who keep this up for one or two years and then, boom, they’re down and injured. It’s important to never do too many long races every year because after one, two or three years it can be really hard to recover. For me, 200 or 300 miles a year is the limit.
Kilian Jornet is a multiple record breaking trail runner, endurance athlete and world champion ski mountaineer.
EMELIE FORSBERG Rest! Normally I rest the day after or if it is an ultra at least. If I do a 2-4 hour race I normally go for a small run just to get the circulation going. I also like to treat myself after a race, like foot bath, compex [electrostimulation] take time for yoga, things that are easy and good for the body. Then my mind feels recovered and is soon ready for another hard training week or racing. I think the mind is very important for recovering.
Emelie likes to practise yoga and eat pancakes. ©Emelie Forsberg
Eat pancakesAfter an ultra, where you empty your body quite a lot and also eat chocolate or gels, I like to eat fresh and healthy, at least the first and second day. But pancakes is a standard the morning after, and yes I think pancakes can be pretty healthy..! Specially if I make banana pancakes :)
Emelie Forsberg is a European and world Skyrunning champion
CONRAD STOLTZ
Forget ice baths I don’t go in for compression or ice baths. I used to jump in a cold rivers after training but I'm over it! Compression socks don’t fit well and science hasn’t really proven that ice baths work.
Old school fan: Conrad Stoltz doesn't go in for ice baths or compression. ©zooom.at/markus berger
Refuel properlyBut there are things that are proven to make a difference, fueling and rehydrating properly. Within the first half an hour of training you need to have so many grams of carbs and so much protein to start the recovery. [Advice varies but many sports nutritionists recommend following the for 3:1 carbs to protein ratio.]
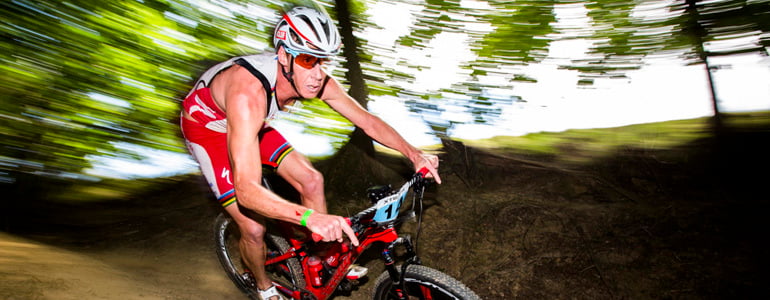
Conrad Stoltz is a four-time XTERRA World Champion triathlete
ÅSA LUNDSTRÖM
Easy rideGo on a very easy bike ride. It helps the circulation going and speeds up the recovery. If the weather is bad or biking is too much trouble (mentally), I sometimes go for an easy walk or stroll.
© Åsa LundströmMassage In big blocks of training, a massage every now and then is very good for recovery, muscle relaxation and preventing injury. It can also be considered a treat for your body after some hard work and helping you relax. I get the massage after a big day of training, as the thing of the day.
UELI STECK
ElectrostimulationI use compex electrostimulstion and try to stretch a lot. Rest days are also good. I just had a rest day so I ran easy the vertical km up to Brevant in Chamonix. I had a drink with a friend then went paragliding.
Ueli Steck during his mission to climb all 82, 4000 m mountains. ©PatitucciPhotoWarm down after exercise I move between 7 and 14 h per day. You start easy the first 30 min and you end the same way. So you have your warm-up and cool down. If possible I try to get my feet in a cold stream.
MATTHIAS SCHERER
Respect your body I really have to say that in the adventure world at the moment recovery and nutrition is not taken seriously. People are strange about hydration. They wear a Suunto Ambit, have the best equipment and then they drink snow water and don’t take things like this seriously! Take electrolyte capsules with minerals to rehydrate properly.
Matthias front lifting weights. ©Tanja SchmittAvoid processed foodsTry to go as long as you can on normal food and then you can start to eat energy bars etc. People push the limits of eating concentrated food which can cause stomach problems. Eat a peanut butter sandwich.
Bring it down slowlyFor recovery it’s important not to stop right away after an ice climbing season. I used to become ill in April when I stopped. Now I continue with skiing and in June and July I keep going to the mountains. I've found cycling helps me to mentally digest everything I've done over the winter. In a week I try to do at least 20 hours on the bike. I work on my films. That's my way of recovery.
Matthias Scherer is a professional ice climber
GREG HILL
Smooth operatorAs a ritual I always have a smoothie after my sporting activities. As quick as I can I am at my blender mixing in my ingredients. Bananas, blueberries, protein mix, raw cacao, milk. That is the base for the majority of my shakes, each food is strong in its own way, combining for a strength building, body recovery, tasty beverage.
Greg making a smoothie at home ©zooom.at/Markus Berger Cross TrainingAnother bit about an ageing body is balance. If over the course of your life you have created imbalances, they become more problematic in later years. To counter act I have been going to the gym to create an overall body fitness not just one designed for peddling a bike or skinning up mountains. Back problems, IT-band issues, all come from unbalance, so cross training is key.
Take some time outAlso to truly have days off. Not partial days off. But couch surfing, suntanning, doing nothing days. You can get away with just one but at least every two weeks to take 2-3 days completely off. This truly helps my body as well as my mind. I come back and feel so much better than if I had pushed through on that extra day of exercise.
Greg Hill is a pro skier. In March 2014 he skied 100,000m in a month
WILLIAM TRUBRIDGE Sleep and eat right “Recovery is as equally important as training. In freediving when you hold your breath it generates a huge amount of carbon dioxide which makes your body very acidic and means all those free radicals cruising around doing damage. Being able to target that with diet that's very rich in antioxidants and making sure you're sleeping right is important.” Drink this:
Will Trubridge's recovery smoothie
My go-to recovery drink after deep training is a green smoothie, with the following ingredients: 1 frozen banana (makes the smoothie cold and creamy) 1 cup almond milk + water added to get the right consistency 2 tbsp Manitoba hemp protein (the best vegetal protein source) 1 tbsp cacao powder (great antioxidant qualities) 1 tbsp Hawaiian spirulina (nature's multivitamin, with many other superfood ingredients like chlorophyll, omega 3,6,9 fatty acids and more) 1 tsp beetroot extract powder (great for blood-building)Everything is blended together, and topped with a dusting of granulated bee pollen.
Will Trubridge is a multiple record breaking freediver
Still need tips on how to recover? Well go explore the recovery options available with the Ambit3

Meet the Norseman!
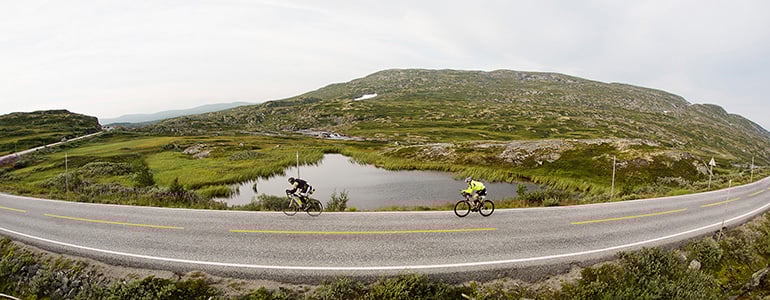
This weekend sees one of the world’s toughest triathlons take place, the Isklar Norseman. It’s a unique unsupported triathlon featuring a 3.8km swim in the frigid waters of the Hardangerfjord, a 180km bike ride, and is followed by a full marathon with a sting in the tail – an ascent of 1,800 m Gaustatoppen. The total ascent is 5,000 meters. Entrants are warned that they may get ‘unusually emotional’. On the start line will be pro-triathlete and elite Ironman athlete Teemu Lemmettylä. And he’s going out to win. One day before the race, he gives us the race lowdown.
The Norseman proves too much for one competitor. ©agurtxane concellon
Why do it?
The history and the fame of the race… it’s the most challenging xtri competition!
Physically, how much more challenging is it than a regular Ironman? It’s hard to say because Ironman is always an all-out effort. Pushing too hard at the beginning is much more costly in this type of race. I expect that the bigger difference compared will be on the mental side. You have to keep your head together.
The marathon ends with a brutal ascent of Gaustatoppen. ©Jóse luis hourcade
How have you had to prepare differently? On cycling I have had to spent more time in up-hills during the training camps and generally put more focus on cycling because the bike leg is challenging and takes a long time. I have been working on my uphill running and used much more trails. However running hours have been similar to previous years.
Teemu Lemmettylä is an elite Ironman athlete. ©Teemu Lemmettylä
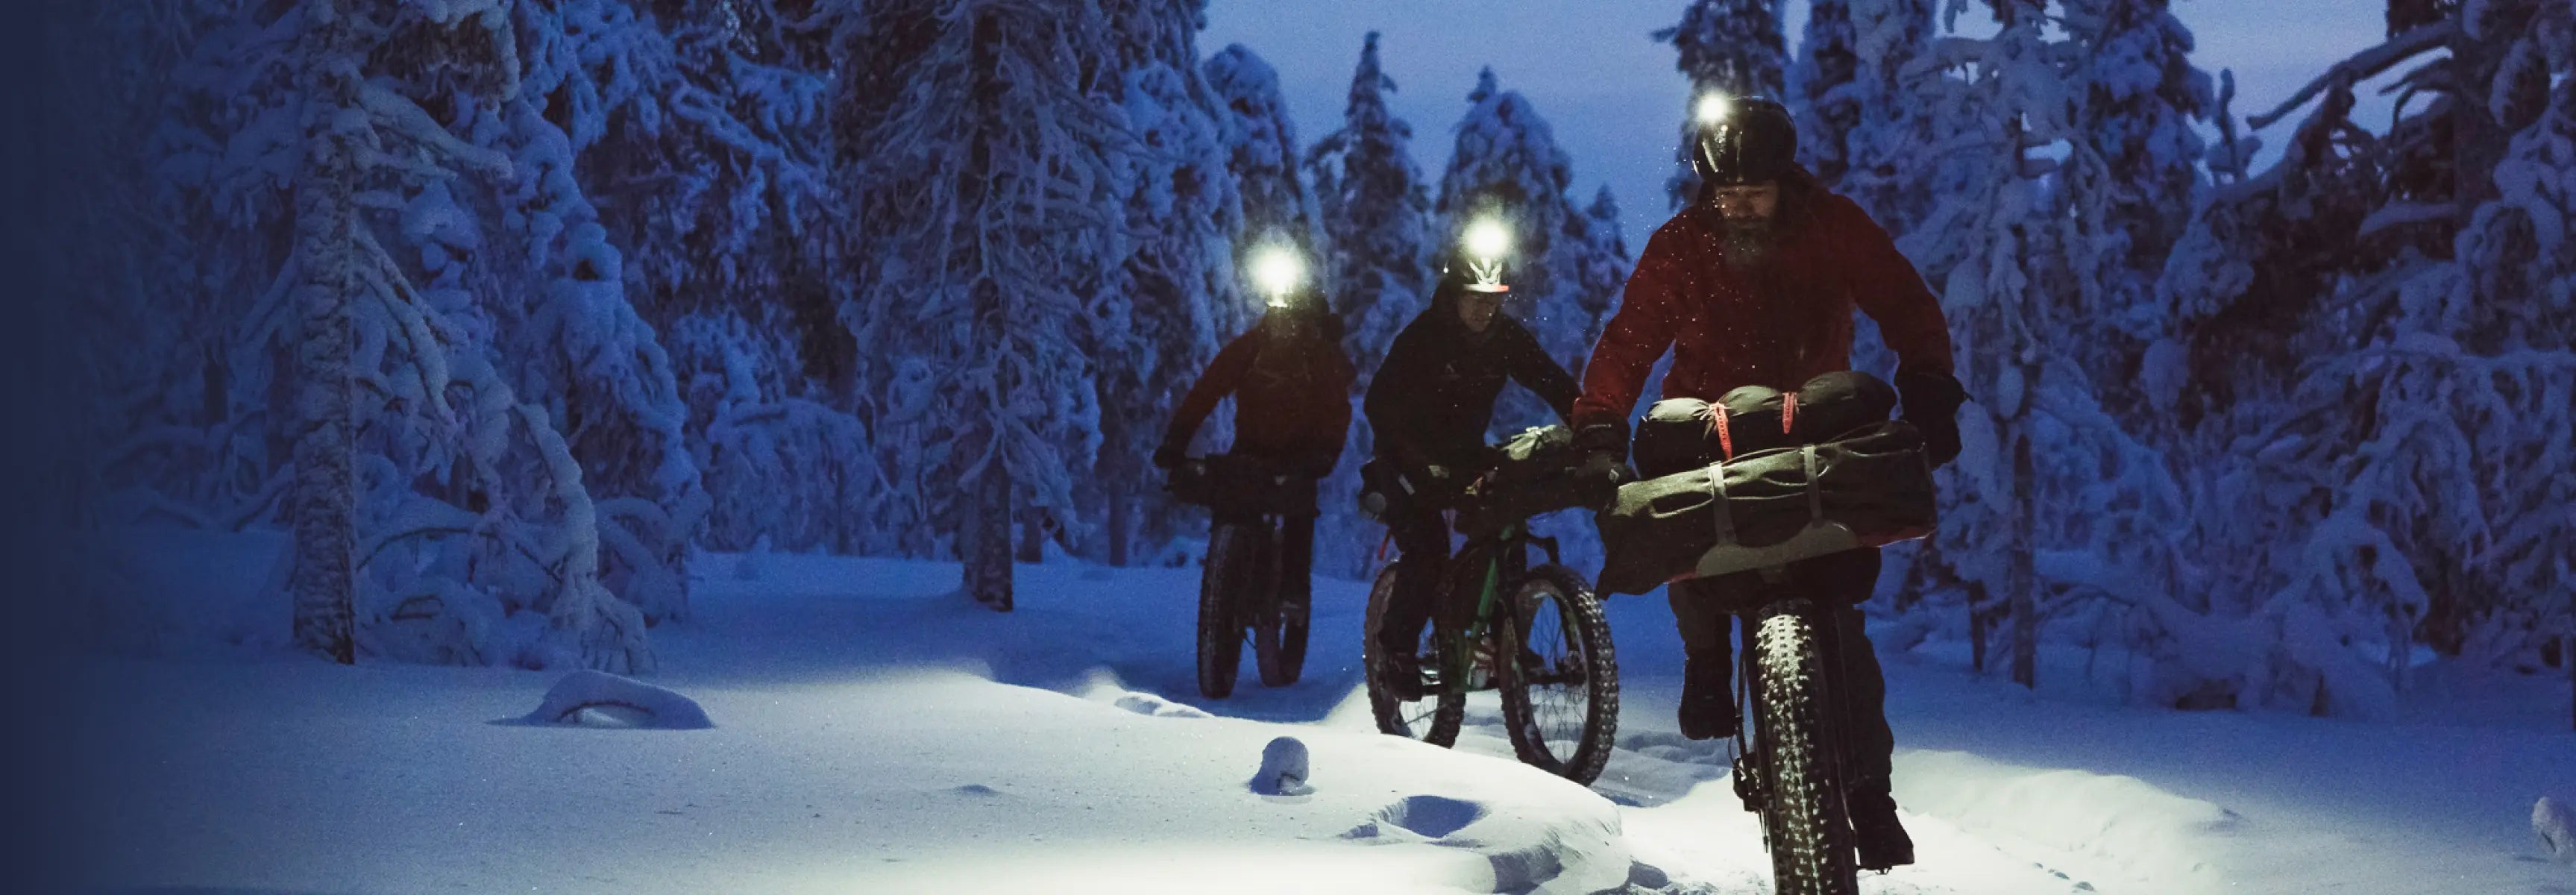
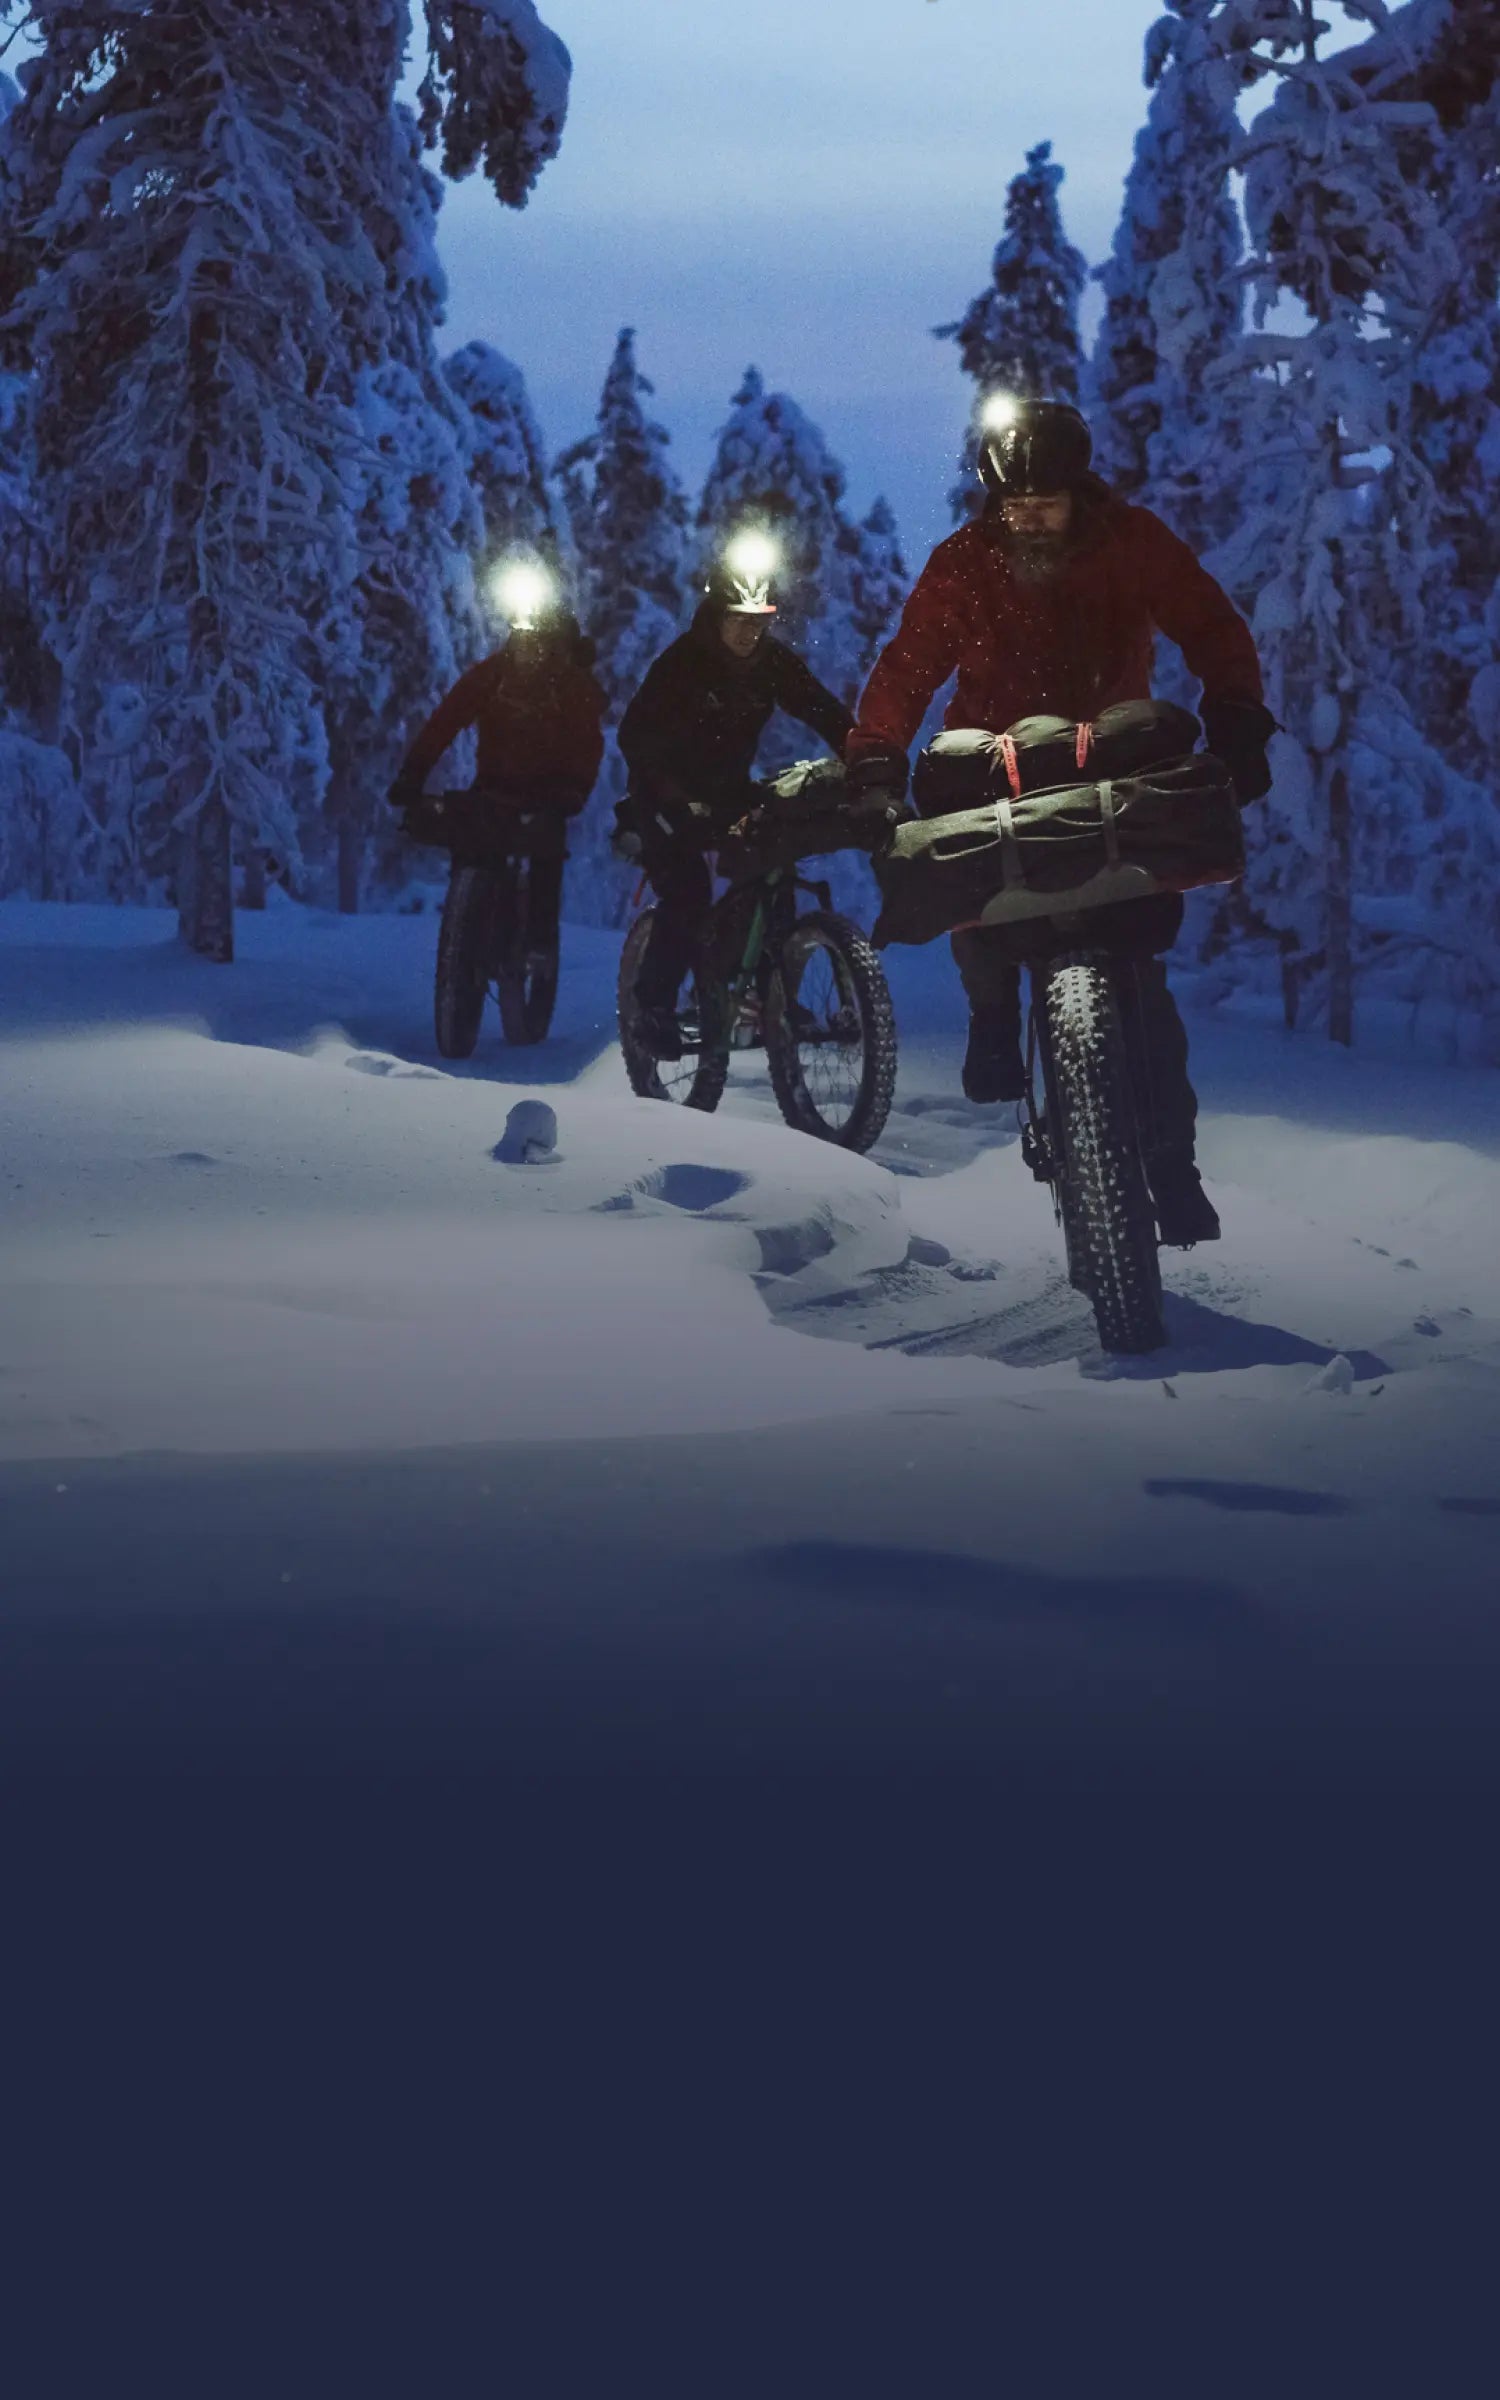
Are you concerned about conditions? Weather can range from beautifully sunny to blizzard? Training in Finland contains enough cold and bad weather which should not be a problem!
Do you think you can win? Anything is possible. On regular triathlon I should be the best from the pack. But this is my first Norseman – it’s just impossible to say for sure.
The race begins with an early start – and a cold one! ©Dag Oliver
Main header image: ©Jóse luis hourcade

Triathlon transition tips from the Caveman
Legendary South African triathlete Conrad Stotlz, known fondly as the Caveman due to his large stature and rough and rugged ways, knows well how to dominate a triathalon.
He's a four time XTERRA Triathlon World Champion and a three time ITU Cross Triathlon World Champion and mountain biking is his strongest discipline.
In this video he shares his tips to transition from swimming to mountain biking. The Caveman shows us how to do it like a pro.
Meet Conrad face-to-face in episode 5 of the #SuuntoAdventure video series.
Click here to read about how Conrad earned the nickname Caveman

HOW TO USE AMBIT3’S RECOVERY FEATURES
To help you balance your training Suunto Ambit3 has two recovery indicators: recovery time and recovery status. Read on and learn how to take advantage of these features.
RECOVERY TIME
Recovery time is an estimate of how long your body needs to recuperate after training. The time is based on the duration and intensity of the session, as well as the overall fatigue, accumulating even at lower intensities. Recovery time accumulates from one session to the next, if you train again before the time has expired. A graph of your recovery time is displayed as one of the screens in the time mode. When entering the logbook, the recovery time in hours is displayed on the screen.
There is one important point to remember: the time is an estimate that is based on activities you have done with your Ambit3. It doesn’t have information about other aspects of life. Did you sleep enough? Do you have flu? Was your meal nutritious and helpful for your recovery?
To get an accurate indication of your actual recovery state, we recommend using one of the two recovery tests.
REVOVERY STATUS
Recovery status indicates the amount of stress on your autonomic nervous system. The less stress you have, the more recovered you are. Knowing your state of recovery helps you optimize your training and avoid over training or injury.
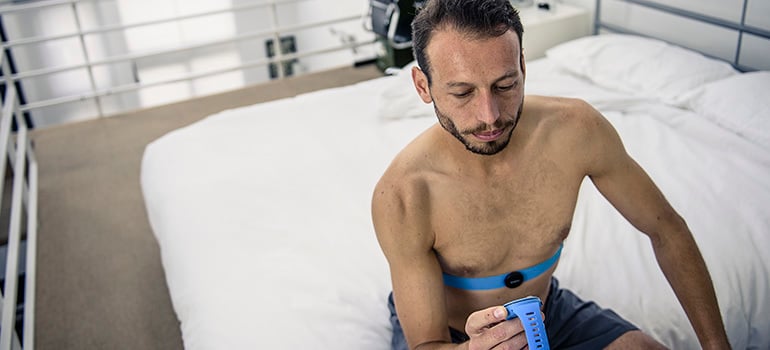
You can check your recovery status with a quick recovery test or sleep recovery test, powered by Firstbeat. The tests require a Bluetooth-compatible heart rate sensor that measures heart rate variability (R-R interval), such as Suunto Smart Sensor.
Your recovery status is indicated with 0-100% result scale.
Result & Explanation
81-100 Fully recovered. OK to train up to very hard intensity.51-80 Recovered. OK to train up to hard intensity.21–50 Recovering. Train easy.0-20 Not recovered. Rest to recover.
The more serious you are with training and the more tests you do, the more important details are, also in the test results. For a top-level athlete a difference of five points in recovery status may be meaningful where as an active runner will be happy with the four point scale presented above.
When entering the logbook, recovery is displayed as your estimated recovery time; if a recovery test is done within the past 24 h and after your previous move, the display will show the result of the last test. This assuming the recovery has been calibrated (see next chapter).
CALIBRATING THE TESTS
When you first start using Ambit3’s recovery tests the watch needs to be calibrated in order to provide accurate, personal results. The calibration tests define what 'fully recovered' means for your body. With each calibration test, your watch adjusts the results scale of the test to match your unique heart rate variability.
You need to perform three calibration tests for both sleep recovery and quick recovery tests. The calibration tests do not need to be done in sequence, but they need to be at least 12 hours apart. These need to be done when you have no accumulated recovery time. Ideally, you also feel fully recovered and are not ill or stressed during these calibration tests.
During the calibration period, you may get results that are higher or lower than expected. These results are indicated in the watch as your estimated recovery status until the calibration is completed. Once you have completed the calibration, the latest result is displayed when you enter the logbook instead of recovery time.
SLEEP RECOVERY TEST
The sleep recovery test, powered by Firstbeat, provides a reliable indicator of your recovery status after a night's sleep.
To perform a sleep recovery test:
Put on your heart rate belt and ensure the electrodes are moist.
Press [Start Stop], scroll to RECOVERY with [Start Stop], and select with [Next].
Scroll to SLEEP TEST and select with [Next].
If you want to cancel the test, press [Back Lap].
When you are ready to get up in the morning, end the test by pressing [Start Stop] or [Next].
The sleep recovery test requires at least two hours of good heart rate data to produce results. The test does not take into account the length of the night meaning you can get similar results after a six-hour sleep and an eight-hour sleep.
If you use your Ambit3’s alarm function, set the alarm first and then start the test. And in the morning stop both your alarm and your sleep recovery test.
During the test you will see the time and SLEEP TEST on the bottom row of the screen.
And last but not least: don’t worry if you have to get up in the middle of the night. This doesn’t make your test unreliable. The test selects the best two-hour period of your sleep and analyzes that.
QUICK RECOVERY TEST
The quick recovery test, powered by Firstbeat, is alternative way to measure your recovery status. The sleep recovery test is a more accurate method to measure your recovery status. But for some individuals, wearing a heart rate sensor throughout the night may not be feasible.
The quick recovery test only takes a few minutes. For best results, you should lie down, stay relaxed, and not move around during the test. We recommend performing the test in the morning after waking up. This helps ensure you get comparable results day to day.
To perform a quick recovery test:
Put on your heart rate belt and ensure the electrodes are moist.
Lie down and relax in a quiet environment free from disturbances.
Press [Start Stop], scroll to RECOVERY with [Start Stop], and select with [Next].
Scroll to Quick test and select with [Next].
Wait for the test to complete.
When the test is complete, scroll through the results with [Next] and [Back Lap].
TROUBLE SHOOTING THE RECOVERY TESTS
There are basically two reason for the tests to fail:
Bad skin contact or low HR belt battery will generate bad data and the test will fail.
If you are too stressed for the test, like right after a training session, the test is likely to fail.
The results of the tests do not impact your estimated recovery time.
Read more about the feature in Firstbeat’s scientific white papers:
Recovery Analysis for Athletic Training Based on Heart Rate Variability
Stress and Recovery Analysis Method Based on 24-hour Heart Rate Variability
Read more Tutorial Tuesday articles at tutorialtuesday
Get support for your Suunto product and find user manuals at support
Face to Face with Conrad Stoltz, #SuuntoAdventure Video Series Episode 5
In the fifth episode of #SuuntoAdventure Video Series four time XTERRA world champion Conrad Stoltz talks about going fast, suffering and over 25 years of competing in triathlon.
Face to Face with Conrad Stoltz, #SuuntoAdventure Video Series Episode 5
Watch also the other episodes in the series:
Face to Face with Emelie Forsberg – #SuuntoAdventure Video Series, Episode 1
Face to Face with Greg Hill – #SuuntoAdventure Video Series, Episode 2
Face to Face with Kilian Jornet – #SuuntoAdventure Video Series, Episode 3
Face to Face with William Trubridge – #SuuntoAdventure Video Series, Episode 4


AERO WHEELS WILL MAKE YOU FASTER
High profile aero wheels used to be regarded something that were mostly used in time trials and triathlons. But in recent years aerodynamics and aero wheels have taken off in road cycling as well. Decrease in aerodynamic drag and increase in speed are a welcome addition to any cyclist.
Aerodynamic drag is the main form of resistance working against a cyclist. The benefits of being more aerodynamic are most obvious for fast riders but it helps in slower paced riding too as more time will be spent in the wind.
The most effective way to decrease your drag is to optimize your riding position on the bike. A reduced frontal area will increase the speed – and save you energy.
On the equipment side one of the most important ways to improve aerodynamics is to use high-performance aero wheels. Wheels play a key role in aerodynamics since the front wheel is pushing through the air first. Its shape is complex.
The most crucial part of the aero wheels is the height of the rim as well as its width and overall shape. The profile of the rim smoothes the air coming around the tyre and rim. Basically the higher the profile, the less drag the wheels produce. For this reason full disk wheels are the most aerodynamic – and the fastest. However, disk wheels are more difficult to use in cross winds.
The rim height and profile are not the only components affecting the aerodynamics of a wheel. A wheel is an entity where every component from rims to spokes, hubs and tyres have their own role and effect on performance.
The overall rim-tyre shape improves the riding characteristics of high profile wheels in windy conditions. When both together are forming a perfect airfoil shape (NACA profile), side wind resistance is reduced and stability improved. This makes 60 mm tall rims pretty easy to ride in much more conditions than one would think.
A great example of this is Mavic’s integrated wheel-tyre systems. They smoothe airflow around the tyre and wheel, and improve streamlined airflow at every yaw angle.
Mavic Cosmic CXR 60’s unique CX01 technology unifies the rim and tyre together, saves time and watts in every condition and provides high stability in crosswind. Their 60 mm wind tunnel optimized rim profile with extra-light carbon rims fitted with Yksion CXR tyres enable a very dynamic ride.
Action images: © Loris Von Siebenthal / Mavic


