


Suunto Blog

Living peak adventure: navigate a route
You’ve reached the fifth and final article in the Living Peak Adventure series, which gives you everything you need to know to find, create and navigate routes that’ll keep you stoked. The series covers:
How to find hot routes with Suunto app heatmaps
How to find popular starting points
How to create your own routes
How to share your routes with friends
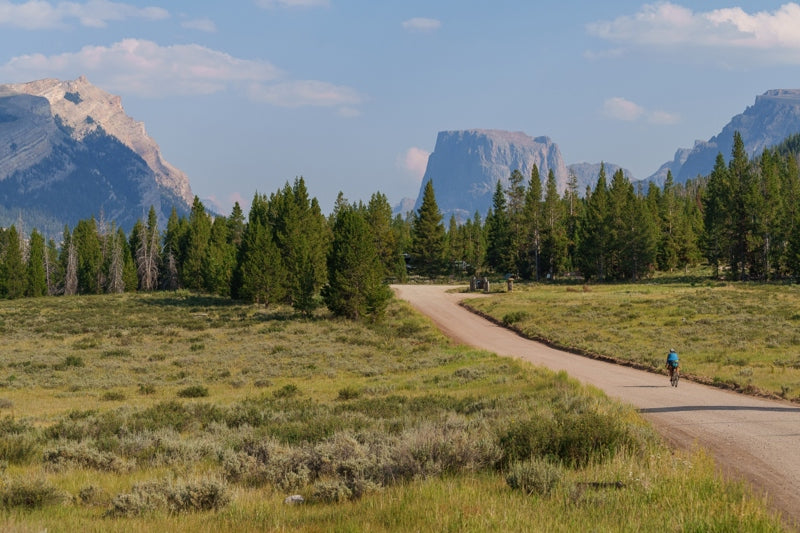
How to navigate a route outdoors
How to navigate a route outdoors
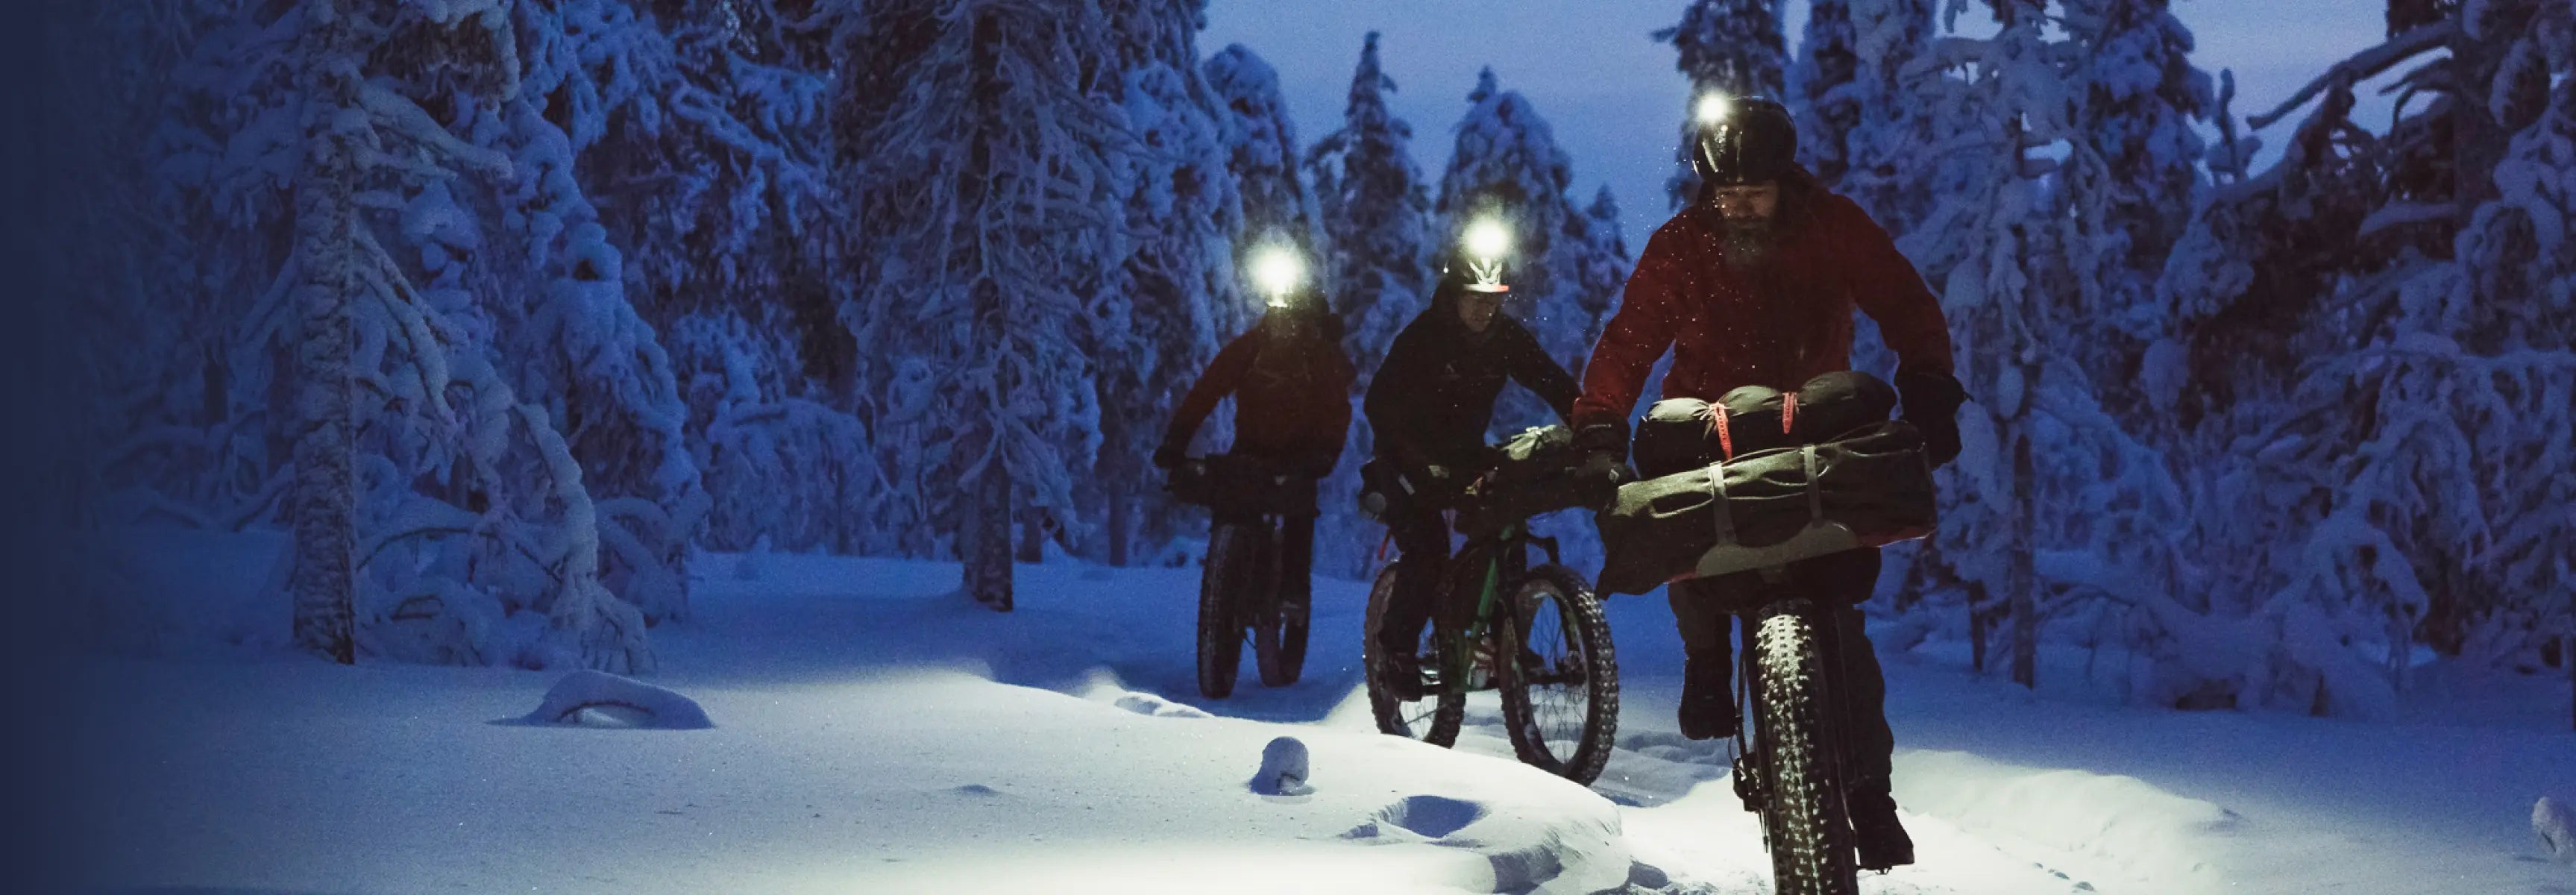
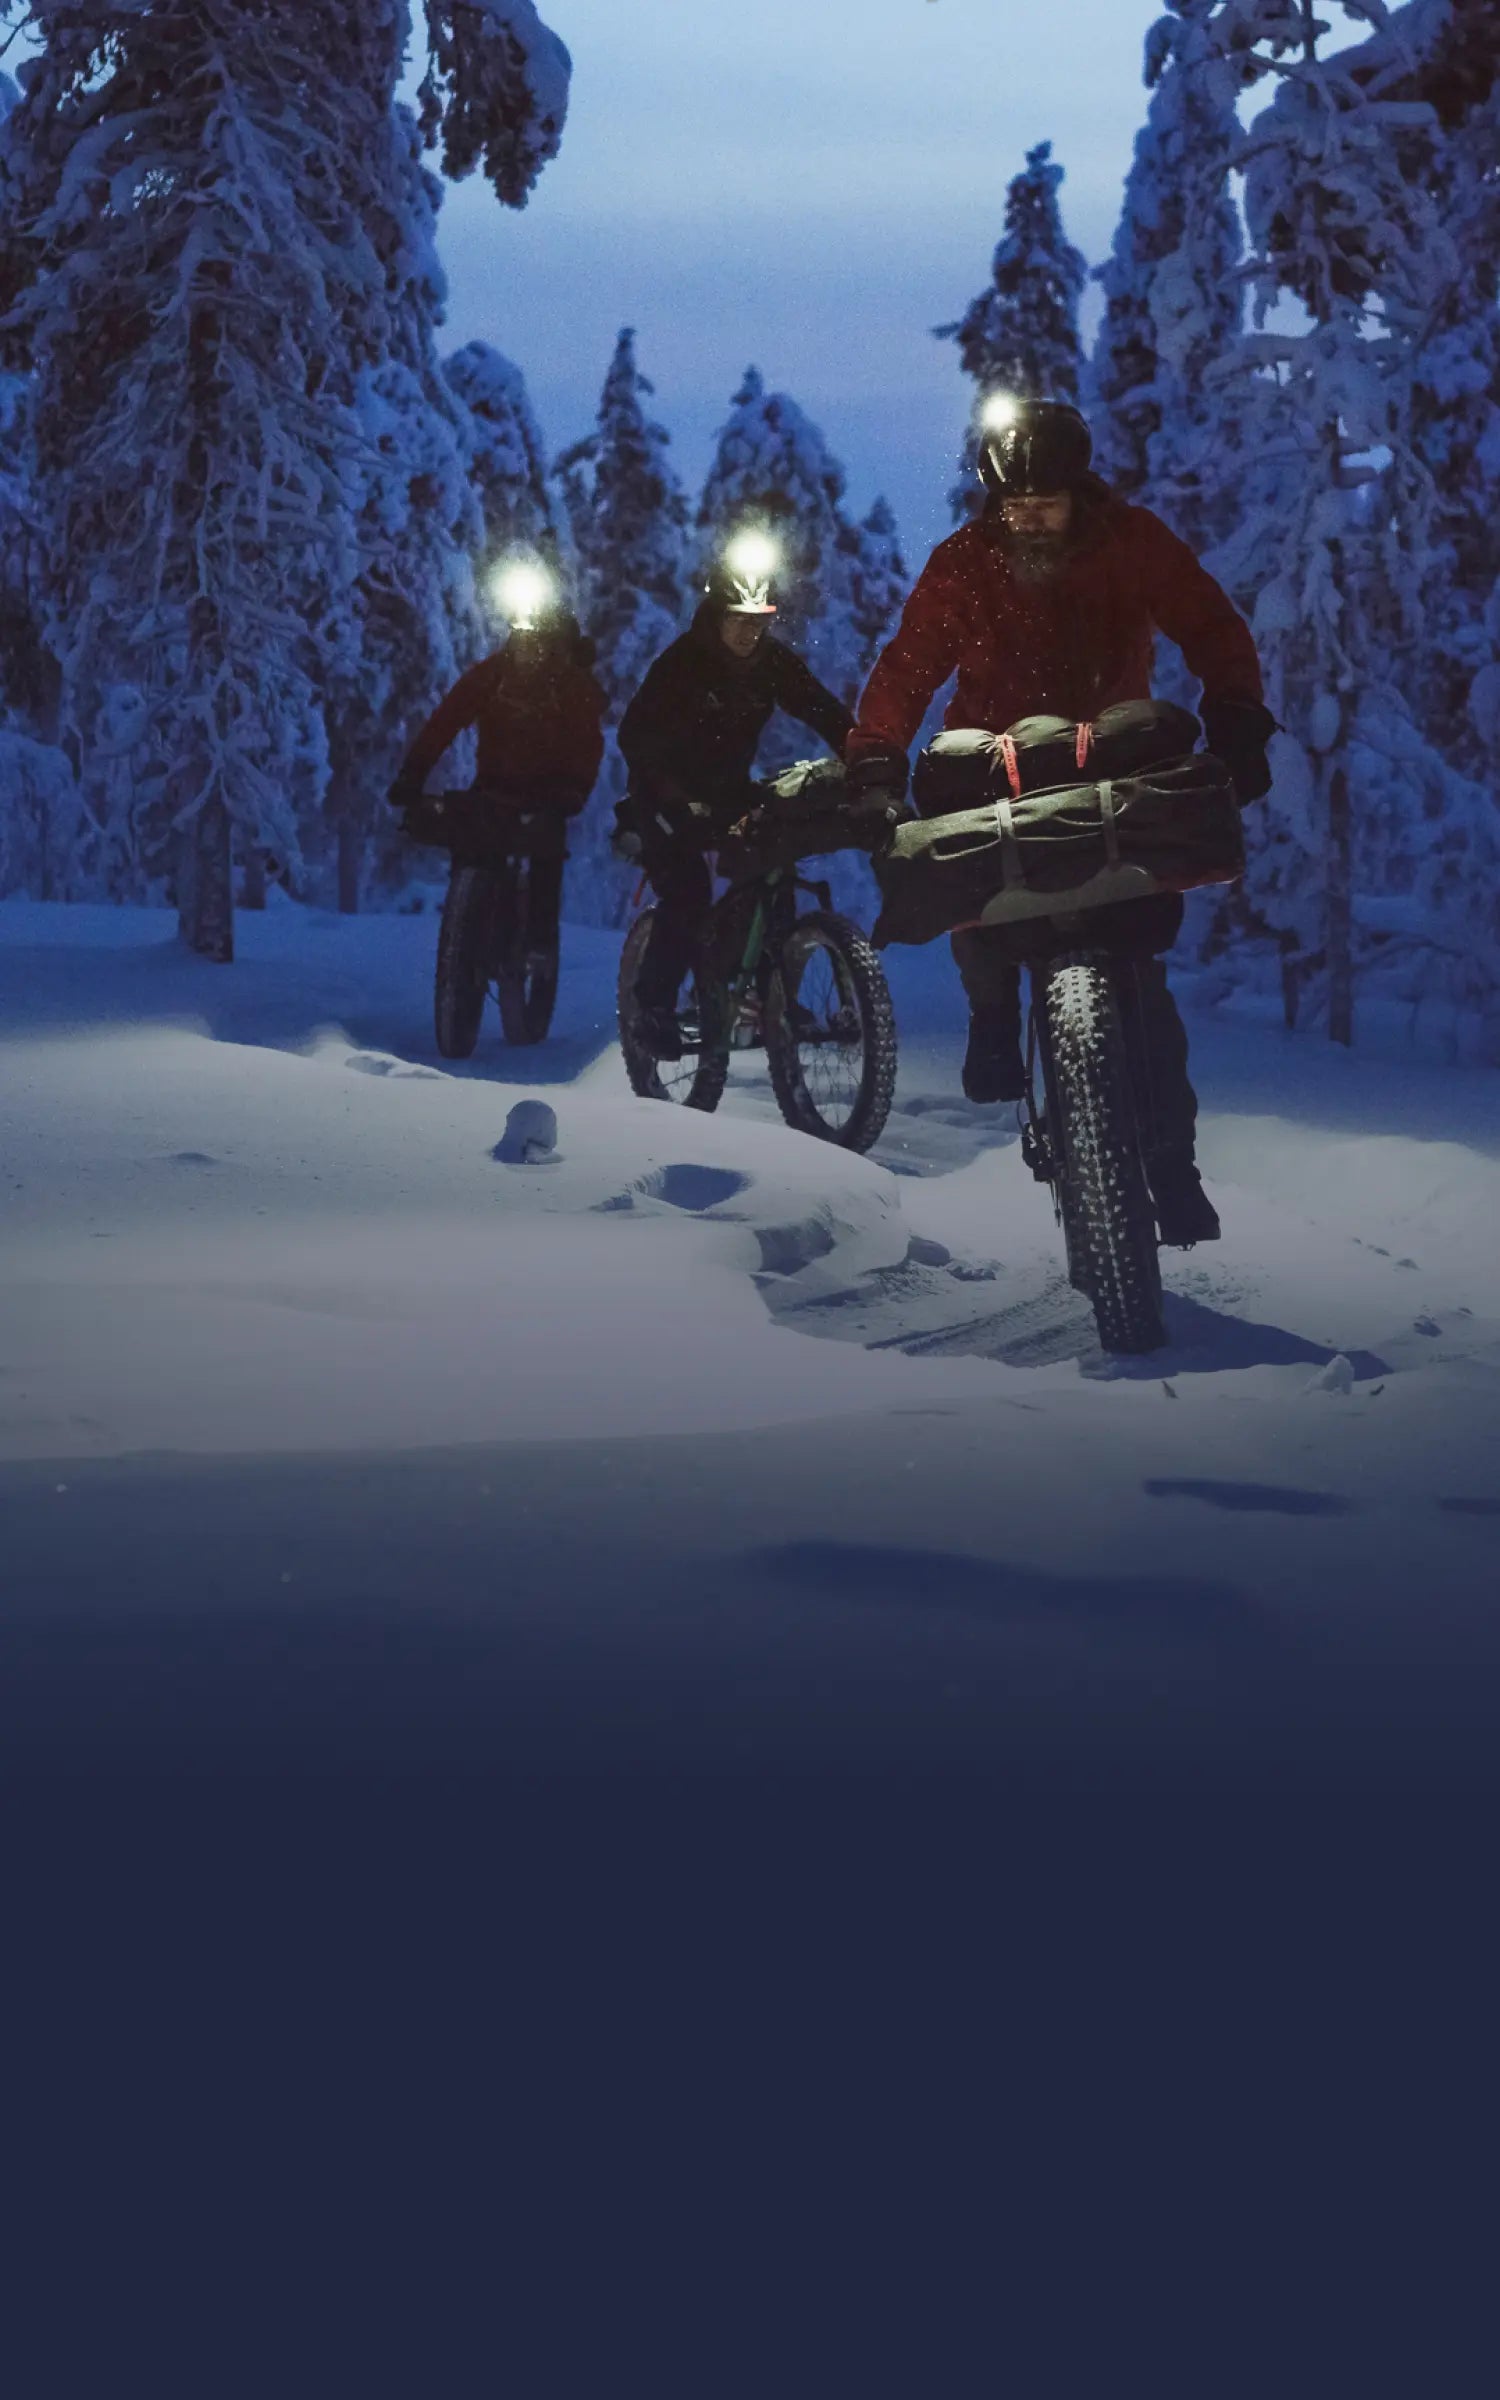
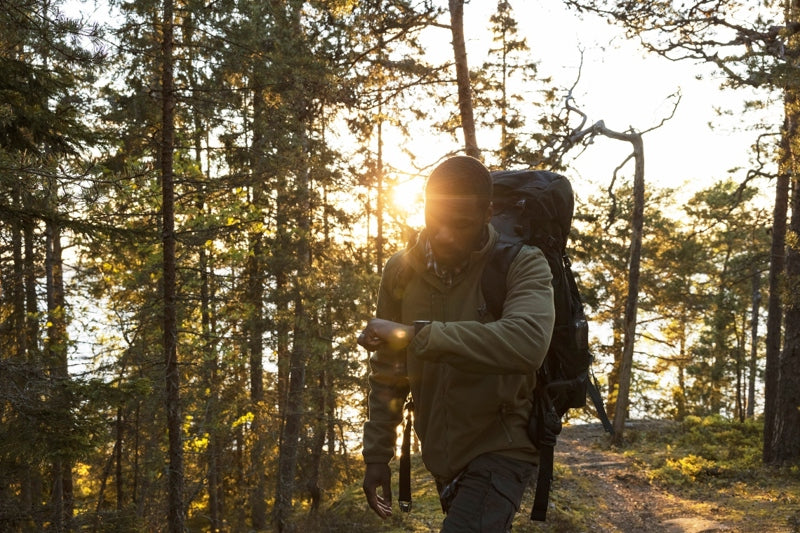
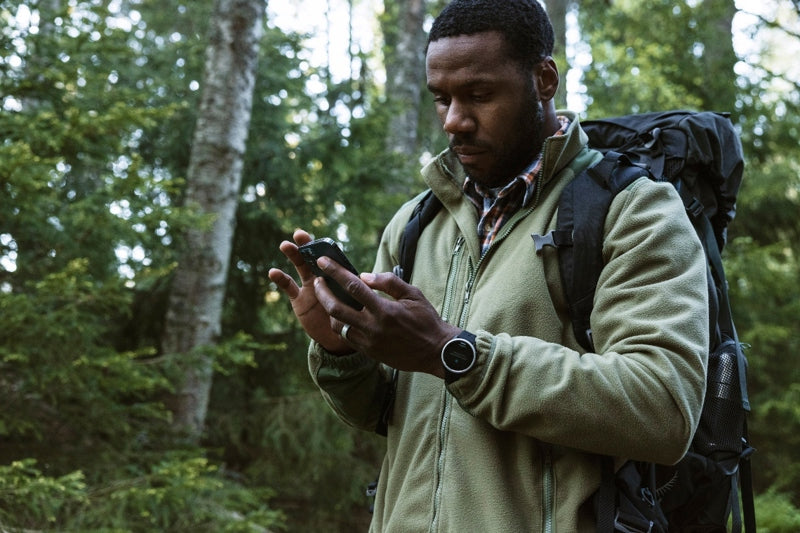
Say it’s time to head out on that two night hike with your adventure buddies; you synced the route - with turn-by-turn guidance on - that you created in Suunto app with your Suunto GPS watch, and now you’re at the car park and ready to start walking. Let your watch guide you.
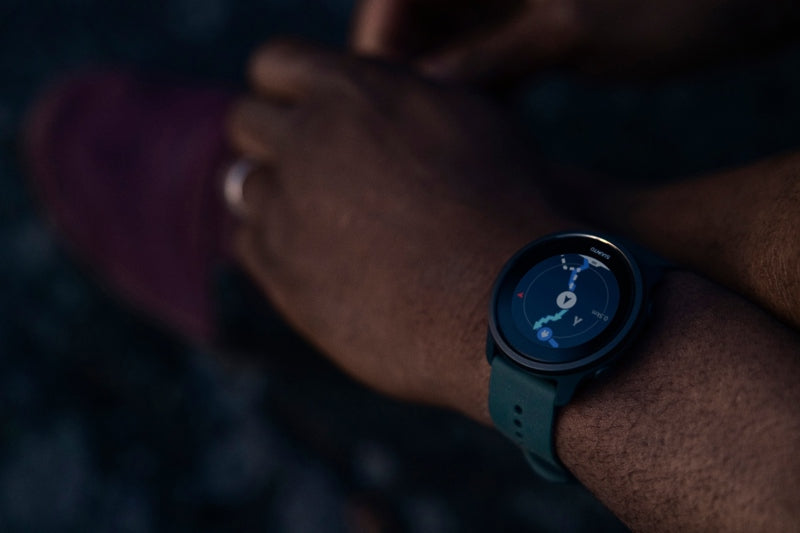
Select the route and navigate
To get started with route navigation, enter the “Exercise” menu on your watch and select your preferred sport mode - in the example above “hiking”. Now, before pressing “Start”, press the bottom button or scroll down to access the “options” menu and select “navigation” then “routes”, then select the relevant route and then tap “navigate”. Once you press start to commence your exercise activity, route navigation will appear as one of your watch screens.
Follow the lines
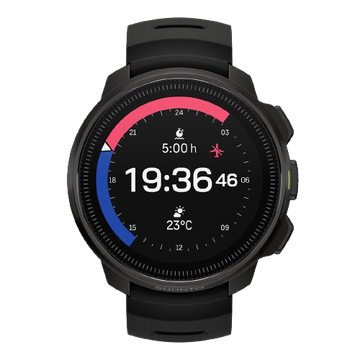
On the watch scree you’ll see two lines:
The dotted “breadcrumb” trail shows the path you have covered
The blue line is your planned route
This is helpful outdoors because perhaps you’ll encounter an obstacle - such as a fallen tree or a swollen river - that you have to go around. The lines will show you where you are in relation to your planned route and how to get back on track.
The breadcrumb line is very useful for another reason: even when you are not navigating a route, you can see the path you have already taken and can use it to backtrack part of or all of the way as required.
You can also zoom in and out of the route navigation view: simply long press the middle button and use the other buttons to zoom.
Turn-by-turn navigation
When creating routes in Suunto app, you can choose to activate turn-by-turn instructions. When the route is transferred to your watch and used for navigation, it will give you turn-by-turn guidance with a sound alert and information on which way to turn. If you go more than 100 m (330 ft) off route, for example, the watch notifies you that you are not on the right track, as well as lets you know when you are back on route.
Now go and explore!
Now you’ve learned the basics by reading this five-part series, it’s time to test out and master all the features at your disposal. Step by step you will build confidence, allowing yout to explore further and further. A world of adventure is awaiting you - get out there!
Learn more about navigation with Suunto 5 Peak, Suunto 9 Peak and Suunto 9 Baro.

Living peak adventure: share your routes
This is the fourth post in the Living Peak Adventure series, which explains how to find, create and navigate awesome routes. The series covers:
How to find hot routes with Suunto app heatmaps
How to find popular starting points
How to create your own routes
How to share your routes with friends
How to navigate a route outdoors
How to share your routes with friends
Imagine spring has finally arrived and you and a group of hiking buddies have found a weekend for a two night hiking trip. You have a general idea of where you’d like to go, but they leave it up to you to decide on the route.
After scanning the area with Suunto app heatmaps, or with one of our partner services like Komoot, FATMAP or Outdooractive, you develop an idea for a nice route. You create your route and now you want to share it with your friends to make sure they’re onboard and to get them excited.
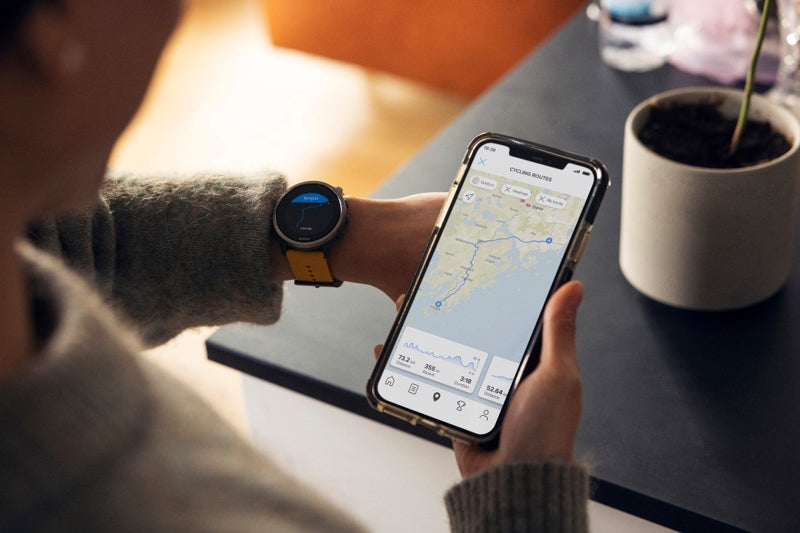
In Suunto app maps, select the “library” button with a bookmark icon. Your library is where you can find all of the routes you have saved. Scroll down to the route and tap the “share” button on the bottom right corner of the map showing the route.
Now you can copy the link and share it via email and so on, or directly share it via your preferred messaging app. All your friends need to do is open the shared file in their Suunto app.
In Suunto app you and your friends can save each others activities as routes for future navigation.
Get inspiration from your friends
If your friends have a public profile, you can open any of their exciting tracks, tap on the "More" icon (three dots), and save that trail to your gallery of routes. Don't forget to show some support and give a shout-out to your friend. And, naturally, your friends can also save the tracks of your activities as routes and use them for navigation.
Read more
How do I import a GPX file in Suunto app for iOS
How do I import a GPX file for Suunto app for Android

Living peak adventure: create your own routes
Whatever outdoor sport you’re into, the Living Peak Adventure article series shows you how to find, create and navigate smoking routes. The series covers:
How to find hot routes with Suunto app heatmaps
How to find popular starting points
How to create your own routes
How to share your routes with friends
How to navigate a route outdoors
How to create your own routes
In the previous two articles, we explained how to find routes and starting points popular with our community. Say you had a look at these and decided they aren’t enough of a challenge for you. Perhaps, as an example, you need to plan out a block of hill training and want to find a route with plenty of vertical ascent. Then create your own!
You can also create routes on the go with Suunto app.
Getting started
Open Suunto app maps and decide where you’d like to start. You can tap the arrow pointer above the search icon on the screen to reveal your current location and start your route there if you like. Just tap on the screen and you have your starting point, presented as a blue circle with A inside.
Choose your mode
Next, you can begin designing your route in a number of ways. On your screen, notice an icon with a mountain, trail and trees symbol - tap that and you’ll open the “routing mode” menu. Select which option fits best for your motivation and activity type. You can select the “free drawing” option if you’re taking paths that might not be on the map and don’t want the app to automatically suggest it. Or, if you’ll be following known roads and paths, select the “any road or path” option. Choose which of the five routing modes make the most sense for you.
Monitor the distance and more
As you create your route, the app will calculate the distance, vertical meters and estimated duration and present this information in a box at the bottom of your screen. That way you can keep track of how long and challenging your route might be.
Toggle between maps
As you extend your route, you can toggle between various map options to help you see exactly where you want it to go. For example, switch from 2D to a 3D map to get a better lay of the land and to look for ascents to include or avoid. You can switch between five different map styles - outdoor, satellite, dark, light and winter - to help you create your route. If you’re planning a winter cross-country skiing route, for example, select the winter map style.
After creating a route you can toggle the turn-by-turn guidance on or off.
Get turn-by-turn guidance
You can choose whether or not the route you create includes turn-by-turn guidance. Simply tap the eye icon at the top of your screen to turn it on or off. When it’s on, this means it will automatically add all the left and right turns and once you’re following your route outdoors your watch will notify you of every turn.
Add waypoints
As you build your route, you can add in waypoints along the way. For example, you can add in camp, cafe, hostel and hotel waypoints to indicate the locations of these along your route. To add a waypoint, simply hold your finger on the map where the waypoint is located and then a menu will pop up. Tap the waypoint icon and then tap the flag icon again when the next menu box appears. Then scroll down to select the type of waypoint it is.
Save your route
You completed building your route, now all you need to do is save it, sync it with your watch and, if you desire, share it with your adventure buddies. To save, tap “done” in the top right corner. A menu box will appear that will tell you the total distance, ascent and duration of your route. Beneath that information, you must name your route, and can edit the activity type if required, turn on and turn off turn-by-turn guidance, and command the app to sync it with your watch. Tap “save” in the bottom right corner. You can now share your route.
You can also create routes on our partner platforms, like Komoot, and sync them to your Suunto for navigation.
Use our partner services
Suunto is proud to have a wide array of partners we cooperate with. Some of these, such as Komoot and FATMAP, are route finding and planning platforms that can enhance what Suunto app offers you.
You can connect your Suunto app account with Komoot or FATMAP, for example, and sync the routes you’ve created in one of those platforms with your Suunto account and watch. Just open Suunto app, tap your profile pic in the top left corner, tap “Partner services”, scroll down and select the platform you’d like to connect to. You’ll then need to login to your account there and confirm you grant it access.
Now you can find or create routes in one of our partner platforms and sync it with your Suunto watch.
Read more
How do I create a route in Suunto app for iOS
How do I create a route in Suunto app for Android
How do I create and sync Points of Interest (POI) with Suunto app

Living peak adventure: find your starting point
The Living Peak Adventure article series gives you everything you need to know to find, create and navigate smoking routes. The series covers:
How to find hot routes with Suunto app heatmaps
How to find popular starting points
How to create your own routes
How to share your routes with friends
How to navigate a route outdoors
How to pinpoint the best starting spots
Say you’ve identified an intriguing mountain range or forest on the map that looks like prime trail running territory. Or maybe you’ve discovered a nice cross-country skiing loop on Suunto app heatmaps, but don’t know the area so well. Now, you just need to know where to park your car and start your adventure; let the Suunto community show you.
Popular starting points are shown in heatmaps as little circles the same color as the activity type you have selected. These circles indicate a parking lot, a trail head or other starting points, such as outside a hotel or apartment complex. They show you where the local Suunto community begins its adventures.
Tap and go
Next, simply tap on a circle you’d like to use as a starting point and an information box with options will appear at the bottom half of your screen. The box confirms it’s a popular starting point, and provides other useful info, such as the sunrise and sunset times, the temperature and coordinates.
Below that you can choose to save the starting point as a POI (point of interest), or to start or end your activity there. Remember you can zoom in on your screen to more clearly see the location and what’s around it so when you arrive there you know what to look for.
Suunto app has heatmaps for 16 different activity types from running, trail running, cycling and mountain biking to activities like ski touring and open water swimming. With the Suunto community behind you, you’ll always find awesome routes and know exactly where to start!
Popular routes
To find popular routes, open the Suunto app map and swipe up from the bottom of the screen. A menu window will open that shows nearby popular routes. Once you’ve found a popular route based on your activity type, tap the route and a box will appear on your screen allowing you to save it and sync it with your watch. You’re good to go.

Living peak adventure: find routes that rock
At Suunto, our purpose is to help you have unforgettable outdoor experiences. We want to make it as easy as possible for you to find, create and navigate trails that simply rock.
So we’ve put together the Living Peak Adventure series so everything you need to know is all in one place. We’ll cover:
How to find hot routes with Suunto app heatmaps
How to find popular starting points
How to create your own routes
How to share your routes with friends
How to navigate a route outdoors
Master this, and your best adventures are still waiting!
Find hot routes with Suunto app heatmaps
Imagine you’ve moved across town or to a new city altogether and you’re looking for some sweet local spots to go mountain biking or trail running, Suunto app heatmaps will show you what’s hot with the locals.
You can view Suunto heatmaps also in 3D!
Based on millions of workouts, Heatmaps highlight the most frequented training spots for more than 16 sports in locations around the world. Just select the activity type for your heatmap, whether trail running, cycling, swimming and so on, and the more our community works out somewhere, the brighter the lines in our maps become (each sport has its own color), making it easy for you to see where to head next. There are five map styles for you to toggle between, depending on your sport, season and what you are looking for.
You can also use heatmaps to identify locations not so popular with our community if you are searching for somewhere quieter or less frequented to go. Look for duller colored lines.
How to use Suunto app heatmaps
First, open Suunto app on your device, then open the map by tapping the location pointer icon on the bottom right corner. Now select the heatmap layer for your sport or activity type and choose your preferred map style. Zoom in to look more closely at particular trails or areas of interest. The brighter the lines, the more popular those routes are.
Switch from 2D to 3D
You can also switch between a standard 2D map and a 3D map. The former gives you an overview of the location and the popular routes, while the latter, when you zoom in, gives a better sense of the topography - hills, valley and mountains and so on.
Switch between 3D and 2D maps and different map layers to get the most out of heatmaps.
Whether you select the 2D or 3D map, you can zoom in and create your own route. Simply tap the plus symbol on the lower right side and tap where on the map you’d like your route to start. Then keep tapping on the map where you’d like your route to extend to. Suunto app will calculate the distance, vertical meters and estimated duration and present it at the bottom of the screen as you create your route. As you build it, you can switch between different map styles, 2D and 3D, and with heatmaps on and off.
Once you are ready, save your route, sync it to your Suunto watch and get out there!
Learn more about the navigation features, map styles and routes with the Suunto app 🔺
Stay tuned for the rest of the five part series to learn how to live peak adventure with your watch from Suunto!

How to mix it up when you love too many outdoor sports
With winter deepening in Boulder, Colorado Suunto athlete Anton Krupicka is dusting off his ski gear and getting ready for some big skimo days in the mountains.
This builds on a huge summer of adventure that saw him complete an epic tour that involved cycling to five different 4000 m mountains, running up as far as possible and then climbing to each summit.
We wondered how in the world Anton finds time to train in all these disciplines and how he strikes a balance. Read on for our Q&A with him.
Read more about Anton here!
What adventures have you been on recently?
I had a pretty busy summer. In June, I rode the Unbound XL gravel race - a 360 mile (579 km) bike race in the Flint Hills of Kansas. It was the farthest I’ve ever ridden in one stretch.
In July, I completed a 2300 mile (4000 km) bike/run/climb tour through Utah, Idaho, Wyoming, Montana, and Colorado where I linked together six different remote technical mountains, starting and finishing at my doorstep in Boulder, Colorado: Kings Peak (13,528 ft / 4123 m), the high point of Utah; the Grand Teton (13,775 ft / 4198 m); Granite Peak (12,807 ft / 3903 m), the high point of Montana; Cloud Peak (13,164 ft / 4012 m), the high point of Wyoming's Bighorn Range; Gannett Peak (13,804 ft / 4207 m), the high point of Wyoming; and Longs Peak (14,255 ft / 4345 m), my backyard mountain here in Boulder, Colorado. I dubbed this trip “Sagebrush & Summits”; those three weeks of riding, running, and climbing were the highlight of my summer.
Finally, in August I ran the Leadville 100, my first ultramarathon in more than six years. This fall, I took a trip back east to North Carolina where we enjoyed some climbing and also a four-day bikepacking trip along the Blue Ridge between Boone and Asheville. That was more for relaxation and recovery, though.
That’s huge! Anything coming up?
Right now, I’m looking forward to skimo racing this winter and hopefully a bikepacking trip to southern Arizona over the winter. I’m already scheming a bikepacking tour for next summer that can top Sagebrush & Summits, though!
You love to mix disciplines; how do you approach this from a training perspective? How do you build in enough recovery time?
It’s all intuitive. I tend to specialize a little bit more as a key objective approaches, but in general I’m trying to balance running, climbing and cycling, and skiing in the winter.
A typical week will probably see me biking 3-4 days, running 2-4 days, and climbing 2-3 days. I do some kind of cardio every day. I typically go on a bike ride after climbing (after having already ridden to the crag), and I use the bike/climb days as recovery from the running days. On days that I run, I usually only run. That’s the general thought process.
What I do is further influenced by the weather forecast - I’m constantly paying attention to weather patterns! - as I prefer to run on cooler or wetter days, and ride/climb on sunnier/drier days, and, of course, run/climb in the alpine when the weather is favorable.
What signals do you look for in your body to determine where you’re at and when you need more recovery time?
Everything is ultimately determined by what my body is telling me. Specifically, how my Achilles is feeling and how it’s responding to the stresses I’m placing on it. As for taking an easier day, I decide that in the moment. Unless I have some key session that I want to be sure to hit before a goal (say, a long run before an ultra or a long bike ride before a bike race), all of my easy/recovery days are determined by how my energy levels are feeling on the day. If I’m feeling good and my body is feeling sound, I’ll push the pace or the distance, or both, in a session. But there are plenty of times where I’ve wanted to hit a harder session and I just don’t have the energy, so I go easy or shorter, sometimes a lot shorter.
What have been some of the key lessons you’ve learned about mixing it up that might be helpful to others who are doing the same thing?
I think you have to realize that you can really only be progressing meaningfully in one activity at a time. That doesn’t mean that I’m not pursuing other activities simultaneously, it’s just that they’re temporarily in maintenance mode. Also, as my previous answer made clear, it’s extremely important to listen to your body and your energy levels and know how they will react to various activities.
For me, running is always the most intense and abusive pursuit. Recovery from that requires only cycling, and probably at a low intensity if I’m really tired. Climbing shouldn’t be classified as active recovery, as the climbing I do usually involves a fair amount of vertical gain/loss in hiking and descending and several multi-pitch routes where more vert is being gained and lost. And if I’m trying to climb hard - at my technical limit - then that’s only going to be possible if I’m not overly tired from running or riding. I love climbing as much as running and cycling - maybe even more - but I rarely prioritize it in any meaningful way. It necessarily takes a back seat because it doesn’t really do anything to further my development in endurance pursuits, where I actually have talent.
Are there any classic pitfalls to avoid?
Like I said above, I think it’s important to not try to progress in more than one activity at a time. I think that usually just ends up being counterproductive.
How has mixing it up made you a better athlete? I guess fun is an important benefit?
Embracing a variety of mountain sports has made me a more well-rounded athlete. It’s also extended my running career - there’s no way that I could only run now and stay healthy enough to race and have it be sustainable. That’s the main benefit.
I don’t like the word “fun”. I think the way it’s typically used is too broad and not incisive enough. What do people really mean when they say “fun”? Often, I think what they really mean is “rewarding”, “satisfying”, or “with joy”. To me, those words imply hard work, challenge, discomfort, and/or intentionality. None of those things, I think, really apply to the textbook definition of “fun”.
The most important benefit to me of mixing up activities is that it has allowed me to grow and learn so much more about each activity and, concurrently, about myself. Having spent several years now pursuing all of these things, I can’t imagine ever going back to being only a runner.
Do you think mixing it up in the way you are is becoming more popular today?
Hmmm, I don’t know. I think to truly reach your potential in a given pursuit you have to be singular in your focus. I did that for a decade-plus with running. But it eventually became physically unsustainable. I think it’s fine to go through phases or seasons in one’s life. I doubt that pursuing multiple sports at the same time is anything new. But, with social media and the internet, we’re probably all just more aware of people who are doing that.
All images by Fred Marmsater


