




Suunto Blog


Red Bull X-ALPS just got tougher
Austrian adventurer, pilot and athlete Paul Gauschlbauer can’t believe come June 20 he’ll be competing in Red Bull X-Alps for the sixth time, and again chasing the Eagle across the Alps. “It means I’ve experienced more than 50 percent of the race’s history, which seems crazy somehow,” he says. “I have really lived and developed along with that race.”
© Nico Holzmeyer
Making a tough race tougher
The 37-year-old Suunto athlete landed in third place in the last three editions of the hike and paragliding race that starts in Salzburg and has, until now, ended on the Mediterranean Sea in Monaco. He is continuing to chase the Eagle, aka Chrigel Maurer, the generational paragliding talent that has won every race since 2009, and seems unassailable in his dominance.
But perhaps the 10th edition will challenge him in new ways. The race organizers – always looking for fresh ways to make the race tougher – have implemented what Paul says is the biggest change in race history; instead of making their way from alpine peaks to the Mediterranean Sea, the 33 competitors will travel a full circle starting in Salzburg, to Mont Blanc and then ending back in the waters of Zell am See, Austria.
“I think it’s tougher to make it to the goal because it’s longer,” Paul says. “We are always staying up in the high mountains. I always had the feeling in previous races that once we made it to Mont Blanc we’d basically already made it to Monaco, because the last stage was usually really fast, no more than a day from Mont Blanc down to the sea. Now we are arriving at Mont Blanc and we have to do the same thing one more time. It’s going to be really challenging.”
© wisthaler.com
The longest Red Bull X-Alps ever
At 1,238 km, it’s the longest route in the race’s history, 100km further than 2019. “It’s a new chapter for the Red Bull X-Alps,” says race director Christoph Weber. “The race committee wanted to make the tenth edition of the race one to remember so we decided to break away from the past and design a completely new route; a route where athletes will be geographically closer together. The days when lead athletes enjoyed good conditions at the front while those further back suffered bad weather is less likely as they’ll all be experiencing the same weather. That will add an interesting dynamic to race.”
One watch for every kilometer
Suunto and Red Bull X-Alps have a long history of working together to help athletes push their limits. To celebrate the 10th and longest edition of the race, we are launching 1238 Suunto 9 Baro Titanium Red Bull X-Alps Limited Edition watches – one for each kilometre of the race. This rare watch has a titanium bezel with Red Bull X-Alps Limited Edition text on both sides and red ink-fill on top. Each one is numbered with a corresponding kilometre of the race. The Special Edition watch has a blue textile quick-release strap in two lengths with a Red Bull X-Alps and Suunto logo. An additional dual color silicone strap is included in the box. Snap one up here!
COVID-19 challenge
Paul and his support person are currently training hard to prepare for the race. The COVID-19 pandemic has made preparation more challenging – Paul and his whole family came down with virus and all fortunately recovered. “I've had a hard time preparing because there was really no assurance that we were really going to race at all, he says. “Now I hope it won’t affect the race anymore.”
© Nico Holtzmeyer
Follow the incredible action live
With Red Bull X-Alps you can count on every single day involving rocky ascents, dizzying flights and crucial, strategic decisions – a challenge for both body and mind. With a more demanding route than ever before, Red Bull X-Alps 2021 will be full of drama, adventure, and high-alpine action. The winner will need to be smart, strong, a master of both planning and reactivity – and have a little bit of luck.
Tune in to the race along with millions of fans via its Live Tracking! Find an athlete from your country and support them from afar!
Lead images: © Nico Holzmeyer


How pressure affect scuba divers - an introduction to diving
We've conquered all the territories above 0m and under. In this article, we set out to show you and explain what happens in your body as you descend into the big blue world.
Diving is an excellent activity with the potential for one-of-a-kind experiences you can only get in an aquatic environment. Our land-loving bodies, however, can react negatively to diving if we are not careful. We are drilling down the essential know-how of diving so you can enjoy it to the fullest.;
Pressure changes: your body needs to adapt.
There are constant fluctuations in the surrounding pressure while we hike or dive into the ocean. Pressure changes 1bar/14.7 PSI for every 10 meters and it increases much faster underwater because water is denser than air. The pressure we face underwater, also called ambient pressure, is caused by the water's weight. The deeper we dive, the greater the ambient pressure will become. Ten meters down is already twice the pressure at the surface.
Discomfort in the ears when taking off in an airplane is also felt just diving down to the bottom of a pool that is three meters deep. When a diver descends, the surrounding water pressure grows. The pressure change underwater will affect spaces that contain air, such as your ears, sinuses, BCD, and mask. But the most significant impact is on your circulatory and respiratory systems and the latter need to be taken seriously because they can lead to major health risks.
What happens after you immerse into water or hike up a mountain?
Our bodies are full of dissolved gases from the air we breathe. Our bodies actively use oxygen for us to function. Other gases, the so-called inert gases like nitrogen, are not used by our bodies but are stored in blood and tissues. While diving, the pressure increases, and our body is exposed to a higher absorption rate of nitrogen stored in our tissues. The amount of inert gas dissolved in our bodies depends on the ambient pressure. Why is it that e don't feel this effect? Because our body is mainly made up of liquids, we are not exposed to pressure. Nevertheless, we feel it in our ears and sinuses because of the air trapped in them.
When we ascend from a dive, the ambient pressure is reduced and the dissolved nitrogen needs to come out (off-gas). We have no problems as long as nitrogen comes out slowly and in a controlled manner without significant pressure differences. If thepressure is released too fast; the nitrogen will come out too fast and cause DCS, also known as decompression sickness, or "the bends."
The amount of gases dissolved in our bodies depends on the ambient pressure around us. That means that every gas has a specific partial pressure, and the combined pressures of the gases in our bodies stay in equilibrium with our environment. Your body is fully saturated with gases at the elevation where you can be found for an extended time. Here are two scenarios that will explain the changes in your body:
If you hike up a mountain, air pressure drops, making your body hold less gas. Your tissues are at this point supersaturated relative to the new ambient pressure. Our bodies release gas through diffusion and breathing to get back to equilibrium, also known as off-gassing.
When you go down to sea level and then underwater, you increase your bodies' pressure, allowing more gas to be carried by blood and tissues. Again, to equalize the pressures, your body takes on more dissolved gas from the air you breathe. This is called on-gassing.
Does the same thing happen when you ascend from a dive?
If we come up from a dive too quickly (therefore, dropping ambient pressure), the natural off-gassing mechanisms are overloaded. The dissolved gas in our bodies comes out of the solution too fast, forming bubbles that can cause decompression sickness or DCS. There are different stages and forms of DCS, and symptoms can range from minor joint pain and skin irritation to severe nerve damage and death. For a diver with DCS, the symptoms may already start while still underwater, or it may take several hours after surfacing. In some cases, the symptoms may not show for several days. Nevertheless, most cases are treatable with, for example, recompression chamber treatment (hyperbaric oxygen treatment).
Diving is made easy to understand and more accessible.
Over the decades, dive algorithms were incorporated into dive computers to calculate how long we can stay underwater with a limited risk of getting DCS. A dive computer knows your dive history and calculates the safety limits in real-time by considering the following metrics: depth, time, gas mix, and personal factors (if applicable).
What is a dive algorithm?
A dive algorithm is a theoretical mathematical formula and does not measure your body's actual physical state while diving. Everybody is different and no dive computer (to this day) can measure the amount of inert gas in every body tissue. Every dive computer has a level of conservatism built in to minimize the risk of DCS and by changing your personal settings, you can add or remove safety margins to your dive algorithm.
What does a dive algorithm do?
Algorithms are designed to give you a safe estimate of how long you can stay at different depths without developing the risk of DCS by considering time/depth/dissolved gas. Some algorithms provide longer dive times at the cost of a higher likelihood of DCS, while others limit the dive time to add a safety margin to your dive.They are used in dive computers based on how inert gases are absorbed and dissolved into and from the diver’s tissues. There are two decompression models most commonly used: the gas model, or the Haldane model, and then the bubble model, known as VPM and RGBM.
The first one is based on J.S Haldane's work and according to his theory, the body is grouped into theoretical tissue compartments, absorbing and releasing inert gas at different rates. This theory is based on avoiding bubble formation by controlling the absorption and release in different theoretical tissue compartments. One commonly used algorithm following the principles of the gas model is the Bühlmann ZHL- 16C.
The second commonly used decompression model is based on the assumption that bubble formation will always be present and the key is to control the size of the formed bubbles. Suunto Fused™ RGBM 2 has been developed with Dr. Bruce Wienke to combine the benefits of the VPM model with Dr. Wienke’s latest full RGBM work.
What should you do?
The important takeaway of this introduction is that every diver and dive are different, so are the underlying assumptions for this incredible sport. In the end, you as a diver will decide what your safety margins are and what theoretical model you want to use for your dives, and those choices will be based on your training, your experience, and eventually, your preferences. Take your time to discover the underworld safely and you will not be disappointed.


Emil Johansson’s long road to recovery
Swedish Slopestyle mountain biker and Suunto athlete Emil Johansson, 21, is most at home defying gravity with his incredible aerial moves. He started riding bikes at eight and 10 years later became the youngest free ride mountain biking world champion in history.
Slopestyle is a specific discipline of mountain biking which combines a lot of airtime with spectacular tricks. It’s similar to free skiing, just with a bike. Emil stunned the world with his talent at a young age.
Emil’s meteoric rise to the top of the sport hit a wall in 2018 and 2019 because he battled injuries and a mysterious autoimmune disease. The disease remained a mystery for some time, with no clear diagnosis, until Emil met Dr. Bachmann, Dr. Jacob and his trainer Lenz Westner, all based in Munich.
“Before I got diagnosed, I didn’t know what was going on,” Emil says. “I wondered why it was happening to me, over and over again? Why am I getting sick and why am I feeling miserable? It’s hard for me to stay healthy while training hard and it’s tough mentally to be comfortable with taking a step back, thinking about my future, rather than just riding flat out all the time.”
Once he was diagnosed, Emil used his Suunto watch to carefully monitor his state of health so he could better understand what was good for his body and mind. The data provided by the watch supported Emil’s rehabilitation and his road back to health and elite competition. After getting the right treatment and knowing what’s good for him, Emil came back stronger than before.
Emil is famous for his dedication and the hard work he puts into his life as a pro athlete. And like many pro athletes, he has tended to push too hard. “I often overtrained my body in the past with lots of sessions both on and off the bike, so I’ve started using my Suunto watch a long time ago to avoid this,” Emil says. “I felt it was the best way for me to get a second opinion on the condition of my body.”
The Slopestyle champion’s Suunto tells him where he is at with his sleep, recovery and heart rate variability. This helps him stay balanced, train efficiently and remain at the top of the sport. “Whatever I am doing, whether it’s gym training, trail riding, cross country skiing or something else, I always wear my Suunto 9 watch as a kind of silent observer of my health and recovery state,” Emil says.
All images by: © Niklas Wallner


Understand and manage your training load with Suunto
The key aspect of progressing in your fitness is your ability to increase your training load over a longer period of time. The variables you can play with are training frequency, duration and intensity. With long-term analysis tools powered by TrainingPeaks you can now manage your training better than ever.
To get started with the graphs it is important to understand the basics: Every workout gets a Training Stress Score (TSS) that is based on the intensity and duration of the workout. That’s the base for calculating training load for both short and long-time averages.
Training Stress Score (TSS) is based on your anaerobic threshold power, but it can also be calculated based on your threshold heart rate or your threshold running pace. You can learn more about TSS values here.
These single activities with their automatically calculated TSS values are then used to show your long-term training load. This long-term load is called Chronic Training Load (CTL) or simply “Fitness”. It is a 42-day weighted average of your TSS. The more you train – the more TSS you accumulate in your training – the higher your fitness is.
While your long-term load is shown as “Fitness”, the short-term training load is called “Fatigue” or Acute Training Load (ATL). Fatigue is a 7-day weighted average of your TSS. When increasing training load your fatigue increases faster than fitness.
These two values, fitness and fatigue, are shown in the upper graph in your Suunto app’s Diary’s ‘Progress’ view. The lower graph shows your “Form”, or Training Stress Balance. Form is basically the difference between long-term, chronic training load (CTL) and short-term, acute training load (ATL). This graph helps you understand if you are training in a way that is progressive or not. Too much load and you are too tired, too little and you are not moving forward.
In Suunto app the Form graph is divided into four areas: losing fitness, maintaining fitness, productive training and going too hard.
When your long-term, chronic training load is quite a bit higher than your acute, short-term load, you will start to lose fitness. Short-term hitting this area is good, for example when you want to be fresh for a race. However, training easier than you are used to for a longer time, will lead you to losing your fitness.
When your current training is roughly in balance with what you are used to doing, you’ll be maintaining your fitness. To improve, add variety and load in your training.
Adding more load will take you to the productive training phase: your fitness and fatigue are increasing in a manageable way. This means you are adding load but not too much compared to what you are used to doing.
If you push too hard and add a lot of training stress compared to your long-term load, your form will drop. This will increase risk of illness and injury and hinder your improvements. Take a step back and allow your body to recover.
Adjust the time frame
When viewing the long-term analyses graphs, you can change the time perspective. Really long-term trends can be seen in the yearly view, that shows the latest four years of your training. In the monthly view you will see the latest 13 months and can easily compare your loads to a year ago, for example. The weekly view with the latest 26 weeks and the daily view with the latest 41 days are more appropriate for managing your current training loads.
If you want to plan your training and see how the graphs will evolve, you can do that with TrainingPeaks’ Performance Management Chart. The activities you track with your Suunto can be automatically synced to TrainingPeaks so you can also use their advanced tools for managing and planning your training. As part of Suunto Value Pack you can get 30 days of TrainingPeaks Premium for free.
Four examples of training load
To make it easier for you to understand what to look for in the graphs, here are four different scenarios:
Example 1: Overload
This graph shows the impacts of a two-week training camp: The training load increases quickly, and at the same time the training stress balance drops very low. In this case the CTL before the camp was 66 and was pushed to 93. At the same time the training stress balance dropped to -79. These low numbers increase the risk of illness and injury.
In this case, the training camp was followed by a recovery week that brought the training stress balance close to zero. Chronic training load still remained at an elevated level (close to 90), so the training camp had a positive impact on this athlete’s fitness.
Example 2: Race
In this graph race preparation is going nicely: The long-term training load is increasing over a long period of time meaning “fitness” is getting better. As the event gets closer, training gets lighter, fatigue goes down and the training stress balance, “form” goes up. The athlete is fresh for the big day.
Example 3: Illness
This graph illustrates the effects of an illness (or other break in training). At first training is going smoothly as CTL is ramping up, but then training stops for one week. ATL goes down quickly and also CTL gets lower. After the break the athlete starts training again gently. It takes about three weeks before her CTL/Fitness starts to be close to the same level she had before the break in training.
Example 4: Normal
This graph illustrates what quite a typical training load graph for an active person may look like: The long-term load is on a fairly good level, but not ramping up. To improve fitness, one needs to add load.
Read more
Training with TSS and hrTSS
Training stress score in Suunto app
3 TrainingPeaks training metrics to adjust your running on the go
View TSS and other power-based cycling metrics in real-time
Figure out your training zones
Main image: © Roger Salanova / Suunto


Training Stress Score in Suunto app
Training load is an essential metric of goal-oriented training. Gradually increasing load will improve fitness and performance. Suunto app quantifies training load using Training Peaks’ Training Stress Score, also known as TSS.
The idea of quantifying training stress was first introduced by E.W. Banister and his research colleagues in 1975. Their model is called “Training Impulse'' (TRIMP). TRIMP is calculated using heart rate and duration: a short but intense workout got a higher score than a longer, easier workout.
Since then several different training load models with the same basic principle have been developed: Quantify the training load by taking into consideration the workout duration and intensity.
The most well-known training load metric is Training Peaks’ Training Stress Score, TSS™. Also Suunto app uses TSS to quantify training load. TSS is calculated based on duration and power-based intensity. (When calculating intensity, anaerobic threshold power, normalised power and intensity factor are taken into account. Learn more about the details here.)
To get a better understanding of the TSS values, it is good to know that a one-hour time trial effort equals 100 TSS. At the same time a three-hour easy bike ride can accumulate the same amount of training stress. As said before, the value always depends on the intensity and duration of the effort.
TSS can be based on power, pace or heart rate
While TSS is originally calculated based on anaerobic threshold power, it can also be based on threshold heart rate or threshold running pace. The suitable TSS calculation method depends on the activity type and data available. Suunto app chooses the method and calculates the TSS automatically. Usually heart rate data is used, but in activities like running and swimming TSS is calculated based on threshold pace and in cycling threshold power.
If there are no measurements available, then Suunto app calculates TSS based on a statistical MET (metabolic equivalent) value. The MET based calculation only considers the duration and the activity type and gives a very rough approximation of the TSS. In order to get good quality TSS metrics, use Suunto heart rate, power or pace.
TSS values in Suunto app
TSS (r) –- Running pace
TSS (hr) – Heart rate
TSS (p) – Power
TSS (s) – Swimming pace
TSS (met) – MET base
TSS- – user has edited the value manually
Correct anaerobic threshold is key
Since TSS is based on workout intensity, your intensity zones need to be correctly set up in your Suunto watch. Suunto has five different zones where the upper limit of zone 4 should be your anaerobic threshold. The default zones in your watch are based on heart rate, but you can also set up advanced zones for running (based on heart rate or pace) and cycling (based on heart rate or power). Adjust your intensity zones on your Suunto 3, Suunto 5 or Suunto 9 at ‘Settings’ -> ‘Training’ -> ‘Intensity zones’.
There are basically three ways to define your heart rate zones: an estimate based on your max heart rate, a field test and a lab test. Learn more about intensity zones and about defining them in this article.
TSS quantifies also the long-term training load
When each of your workouts has a Training Stress Score calculated, long term values can be derived from this. Suunto app Diary’s ‘Progress’ view tracks your training load over time and helps you keep your training in balance – whether that means progress, maintaining your fitness or avoiding over-training.
You will be able to see the long-term load as Cumulative Training Load (CTL) and short-term load as Acute Training Load (ATL). When your CTL and ATL are compared, you will get Training Stress Balance (TSB) that helps you follow changes in your freshness or “form”. Learn more about long-term training load analyses here.
Read more
Training with TSS and hrTSS
Understand and manage your training load with Suunto app
3 TrainingPeaks training metrics to adjust your running on the go
View TSS and other power-based cycling metrics in real-time
Figure out your training zones
Reference
E.W. Banister, T.W. Calvert, M.V. Savage, T. Bach. A systems model of training for athletic performance. Australian Journal of Sports Medicine, (1975) 7:57-61.
Lead image: © Matti Bernitz/Suunto

Two friends pursue history on the Eiger
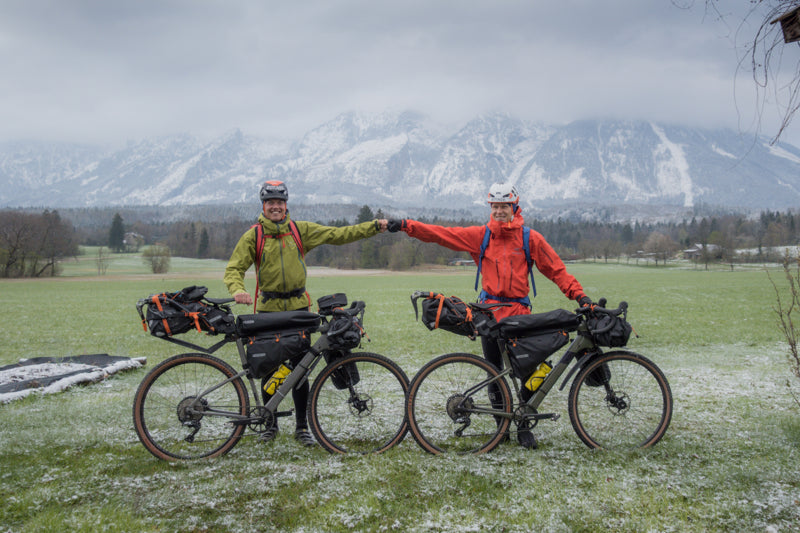
Childhood buddies Philipp Reiter and Martin Schidlowski set off bikepacking from Berchtesgaden in south Germany yesteday following the same historic journey undertaken 85 years ago by German climbers and friends Toni Kurz and Andi Hinterstoisser.
In 1936, early in the Nazi period, Kurz and Hinterstoisser deserted from the German military, and under the cover of darkness began cycling from Berchtesgaden to the base of Eiger in Switzerland, some 600 km away. Their goal? To become the first climbing team to solve the last unsolved climbing problem in the Alps – the sheer, unforgiving North Face of the Eiger (3967 m). However, their climb ended in tragedy, with both climbers, and two Austrian climbers all dying on the wall. The tragic story was captured in the 2008 film, North Face.
“What is cool for me is we will get a little glimpse of an idea of how tough it was and what challenges Kurz and Hinterstoisserand had to face,” Philipp says. “It’s cool to discover how it really was for them.”
The intimidating North Face of Eiger. © Wikimedia Commons User: Terra3 / CC BY-SA 3.0
Philipp and Martin, both Berchtesgaden locals, are undertaking the same journey, with the aim of summitting Eiger via the North Face, to experience firsthand what their compatriots went through. It will take them three days to cycle 600 km, with 6000 m of vertical gain, to reach Grindelwald Valley and the base of the face where they will attempt the 1600 m vertical climb.
A snow dump made the first day a tough ride. @ Nicolas Holtzmeyer
Philipp, a photographer, alpinist and history enthusiast, and Martin, a climber and mountain guide, have been friends since childhood, and having been going on adventures together since 2006. Each year they try to share one adventure that combines endurance and mountaineering.
“Martin is totally not into biking,” Philipp says. “I’m more experienced with biking, and he’s expert in climbing. We make a good team. He’s afraid of the long bike ride, and I’m afraid of the challenging climb. This will be my biggest alpine project. It’s 1600 m straight up!”
The two friends will track their journey with Suunto watches and provide live updates via Suunto Instagram. @ Nicolas Holtzmeyer
This isn’t the first history focused adventure Philipp has initiated. In 2020, he and some friends did a relay run of the 850 km front line where Austrian and Italian troops battled during the First World War. In 2019, Philipp and his friends did the same on the 1400 km border that once divided Germany.
“Back in 1936 it was the Germans against the Austrians, and the Austrians against the Italians,” Philipp continues. “Climbing teams from each country wanted to become the first to scale the North Face. It created a super big hype, like the equivalant of a Superbowl TV broadcast.”
Philipp and Martin won’t have to cope with any competition or a medic circus, but a Bavarian television crew will follow them to document the historic journey. You can follow them on Suunto Instagram!


