


Suunto Blog

Ultra running mantras: Mental fuel for the long haul
Courtney Dauwalter swears by the power of mantras like “Believe” to push through ultra-running challenges. Inspired by her, the ultra community shared their go-to phrases.
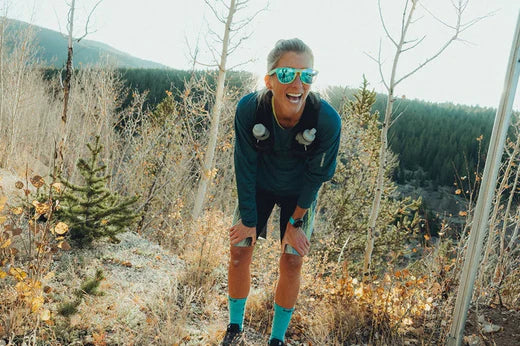
Courtney Dauwalter, one of the greatest athletes in ultra running, has long emphasized the importance of mental toughness. Known for her resilience, Courtney breaks races into manageable milestones, using simple yet powerful mantras such as "embrace the pain" and "right foot, left foot" to manage pain, maintain rhythm, and stay focused.
“Believe is a mantra that I use pretty often,” Courtney shares. “If you just repeat it over and over in your head, there’s no room for anything else but to believe that you can keep on going no matter what it looks like.” For her, the "pain cave" is a mental space where growth happens, a place she visualizes as chiseling away at endurance barriers.
Courtney recently asked her Instagram community: What’s your go-to mantra when it gets tough? The response was overwhelming, with thousands of runners sharing their perseverance-boosting phrases.
Common themes from the ultra community
The responses revealed several themes. Many runners focus on self-empowerment and resilience, with mantras like “I can do hard things” and “You got this” encouraging inner strength. Others emphasize breaking challenges into smaller steps with phrases like “One step at a time” or “Just keep swimming.”
Some runners use humor to cope, with playful mantras like “Don’t die!” or the sarcastic “This is dumb... keep going!” These bring levity to grueling moments. Gratitude also emerged as a motivator, with mantras like “Get to do this” reframing hardship as privilege.
Whether it’s Courtney’s “Believe” or the community’s “I can do hard things,” mantras anchor runners through challenges. They transform overwhelming distances into achievable milestones, carrying runners through the pain cave and beyond. Try one on your next run—you might be surprised how far the right words can take you.
These were the most liked comments on Courtney's post on Instagram:
“I got sober, this is a piece of cake.”
"It is how it is". When my son was diagnosed with an incurable brain tumor age 7 this is what kept him going. Now I carry his memory with me on every trail and know: it is how it is.
"Pain is just French for bread."
"I get to do this" ✨️🏃♀️
...but did you die?
Left foot, Right foot, Left foot, Right foot, Left foot, Right Foot. 👣👣👣
"The faster you run, the faster you’re done.”
“Be savage, not average!” My 11 year old came up with it and I love it
I like to quote Dory from Finding Nemo with, “Just keep swimming”
"Just one more" ....mountain, loop, step....Just one more (ps tattooed in my forearm, from the late Gabe Grunewald, "it's OK to struggle, it's not ok to give up"
“”I’m here for the food 🤤🤤🤤🤤””
“This is what you came for”
“How bad do you want it?”
I “get” to do this ❤️
What if?..what if I actually pull this one off...
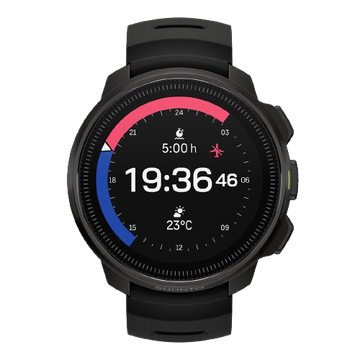
Check out the limited edition Suunto Race S Titanium Courtney sports watch. When the going gets tough, its glow-in-the-dark strap will remind you: Believe!
Learn more about SUUNTO RACE S TITANIUM COURTNEY

The art of endurance: Courtney Dauwalter's vibrant approach to ultra running
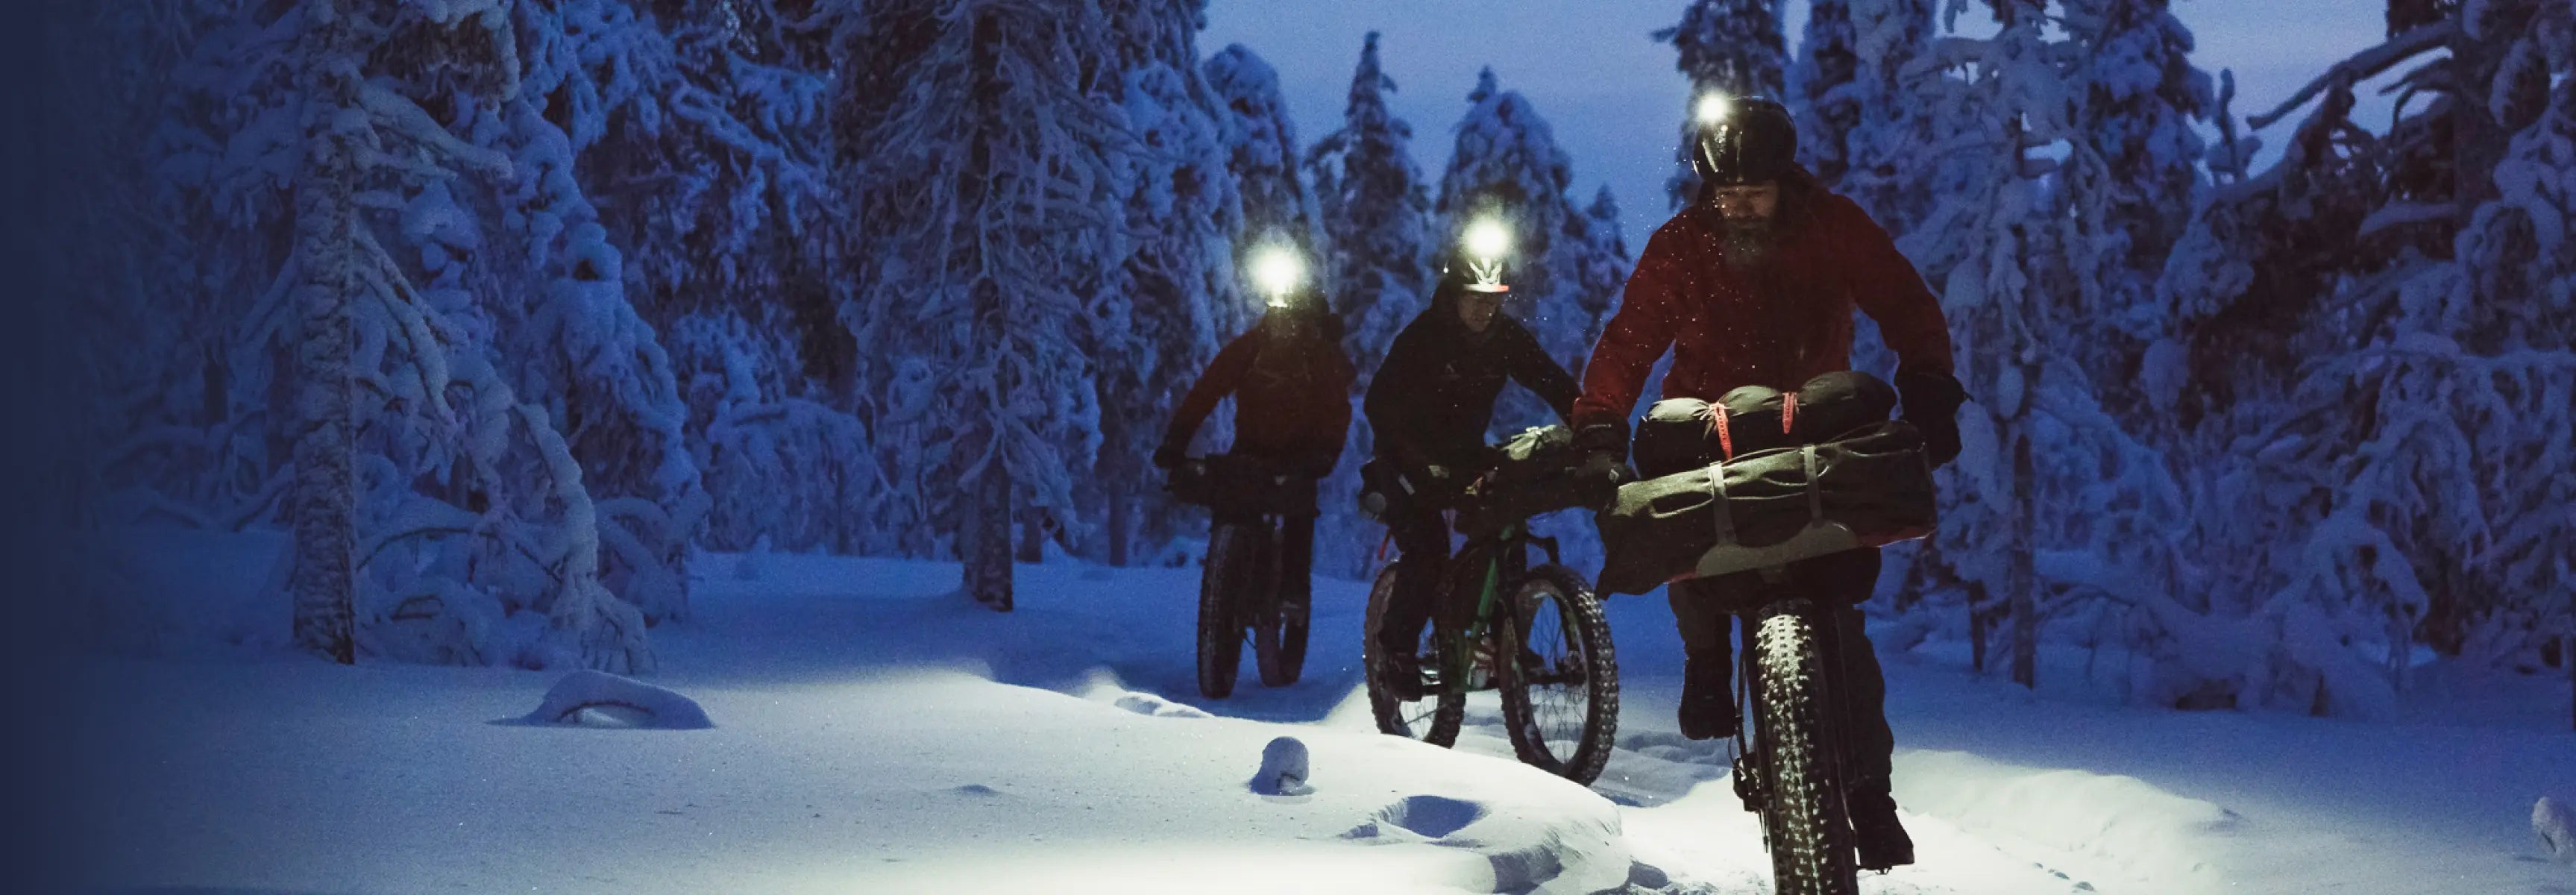
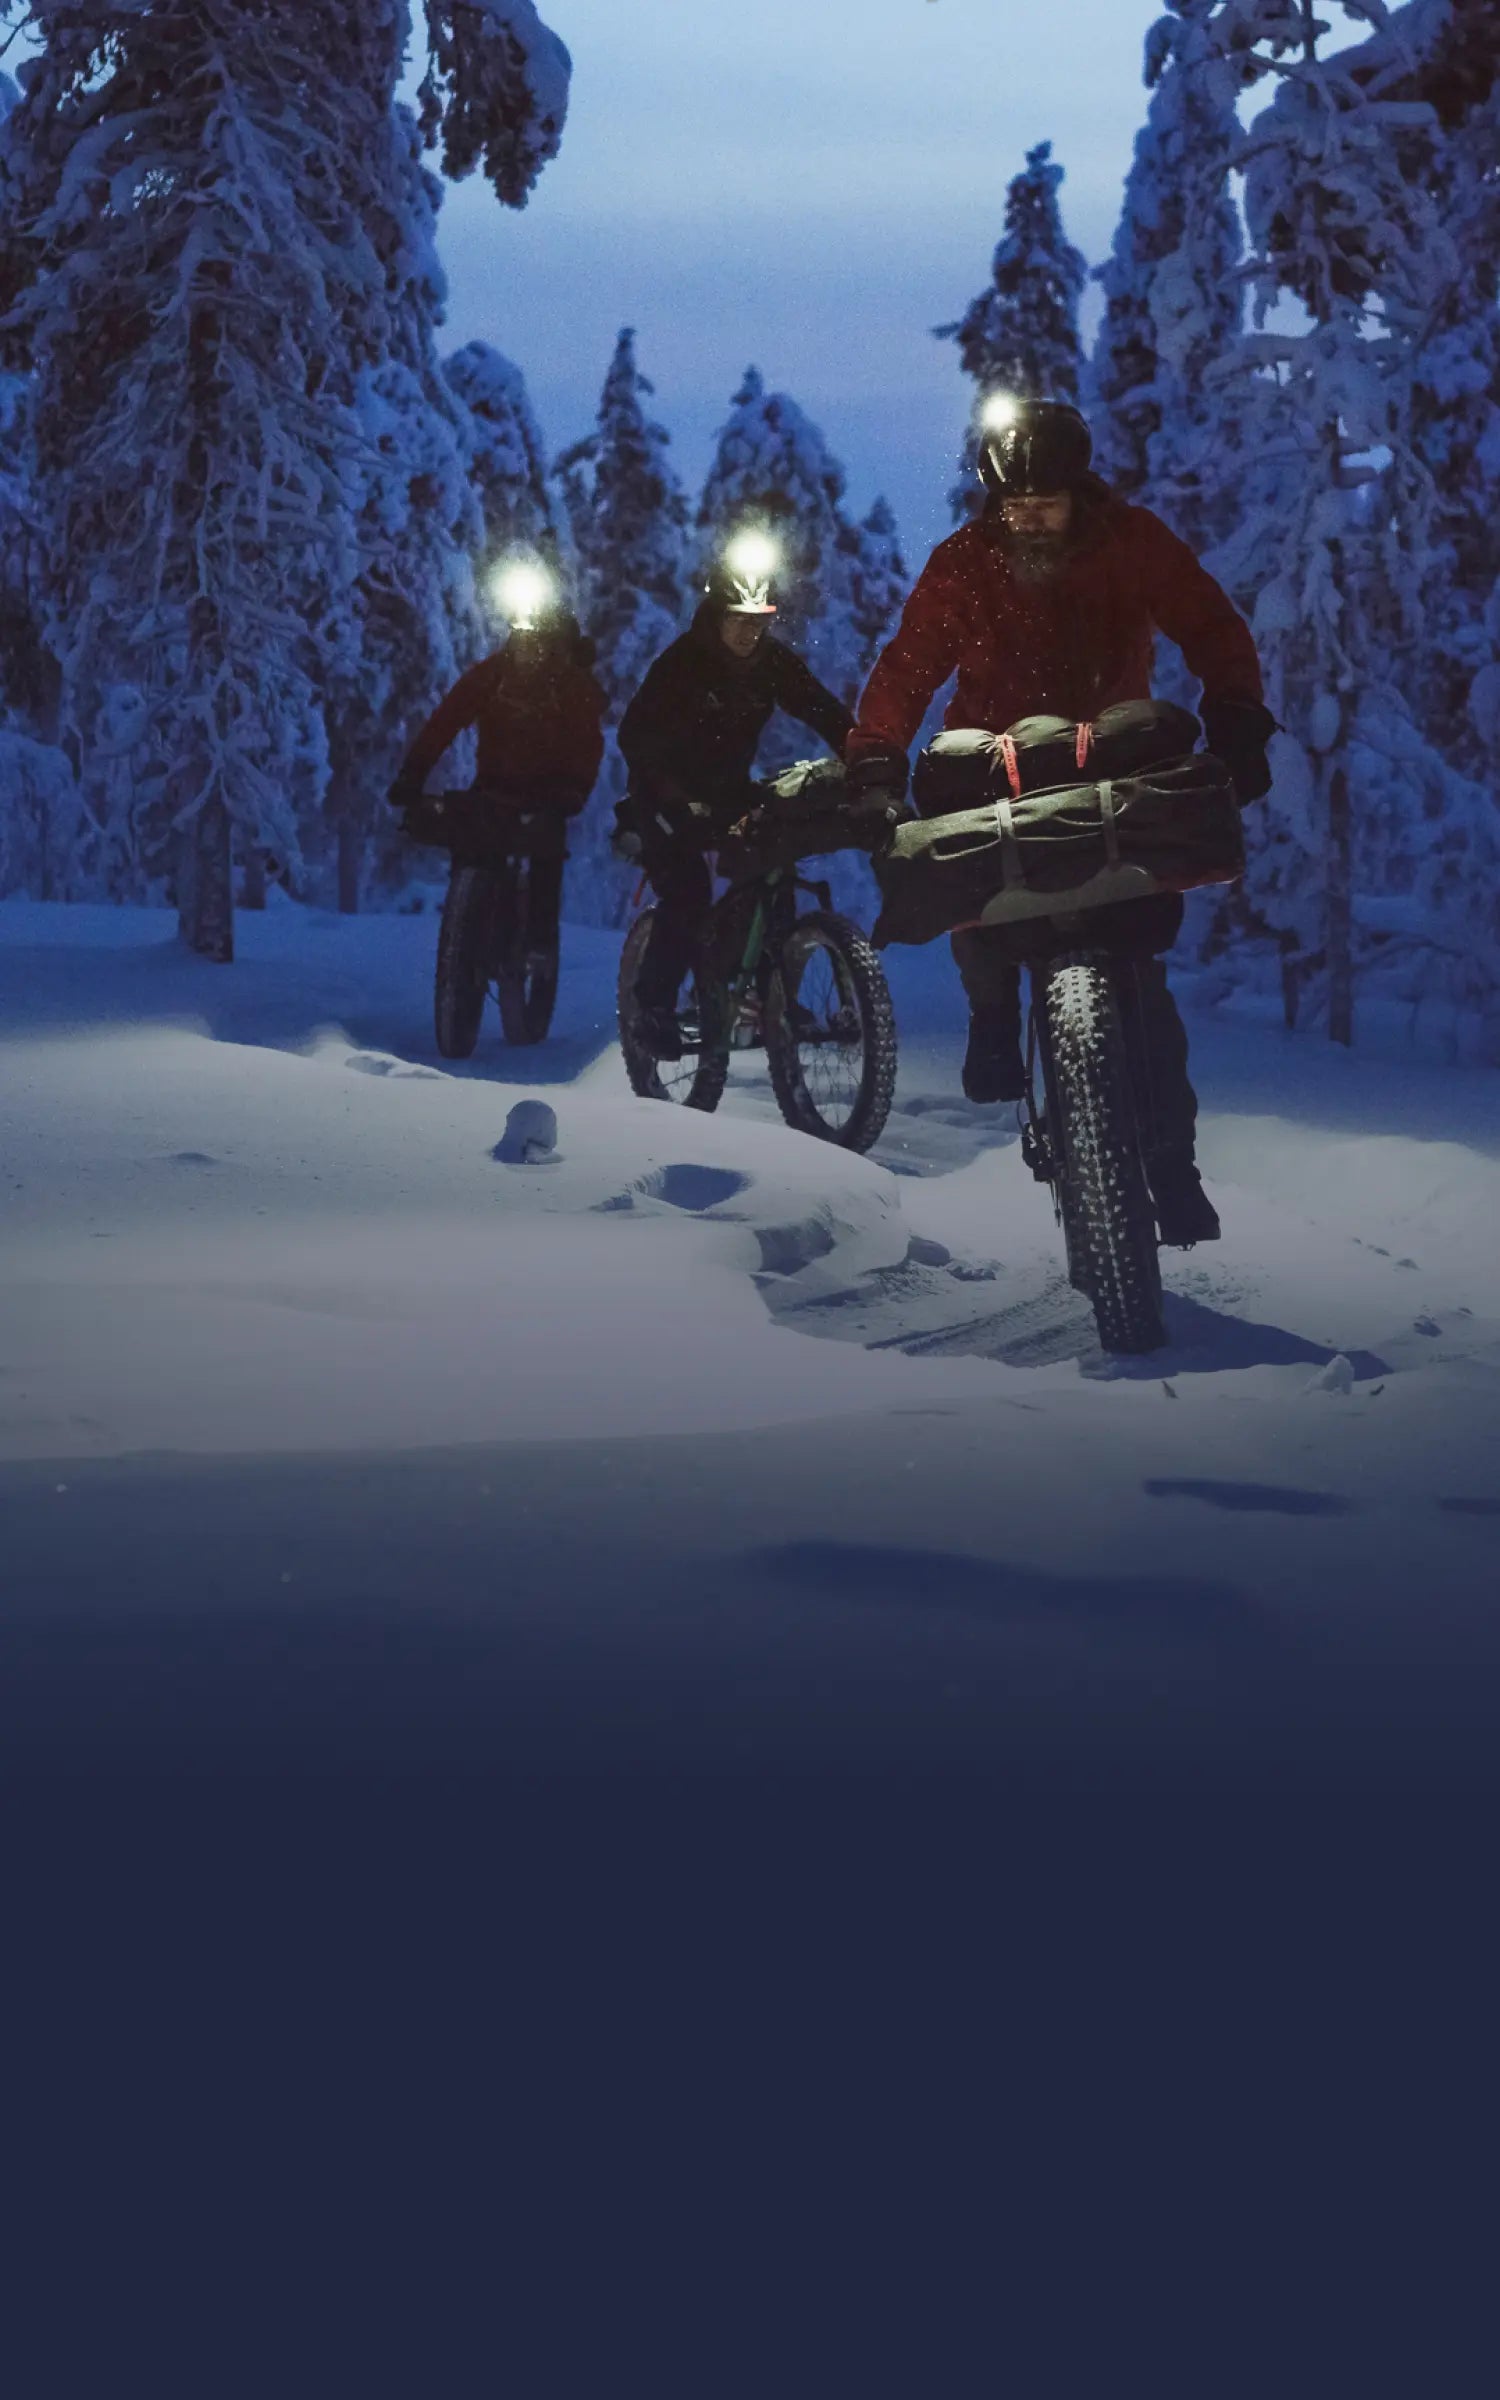
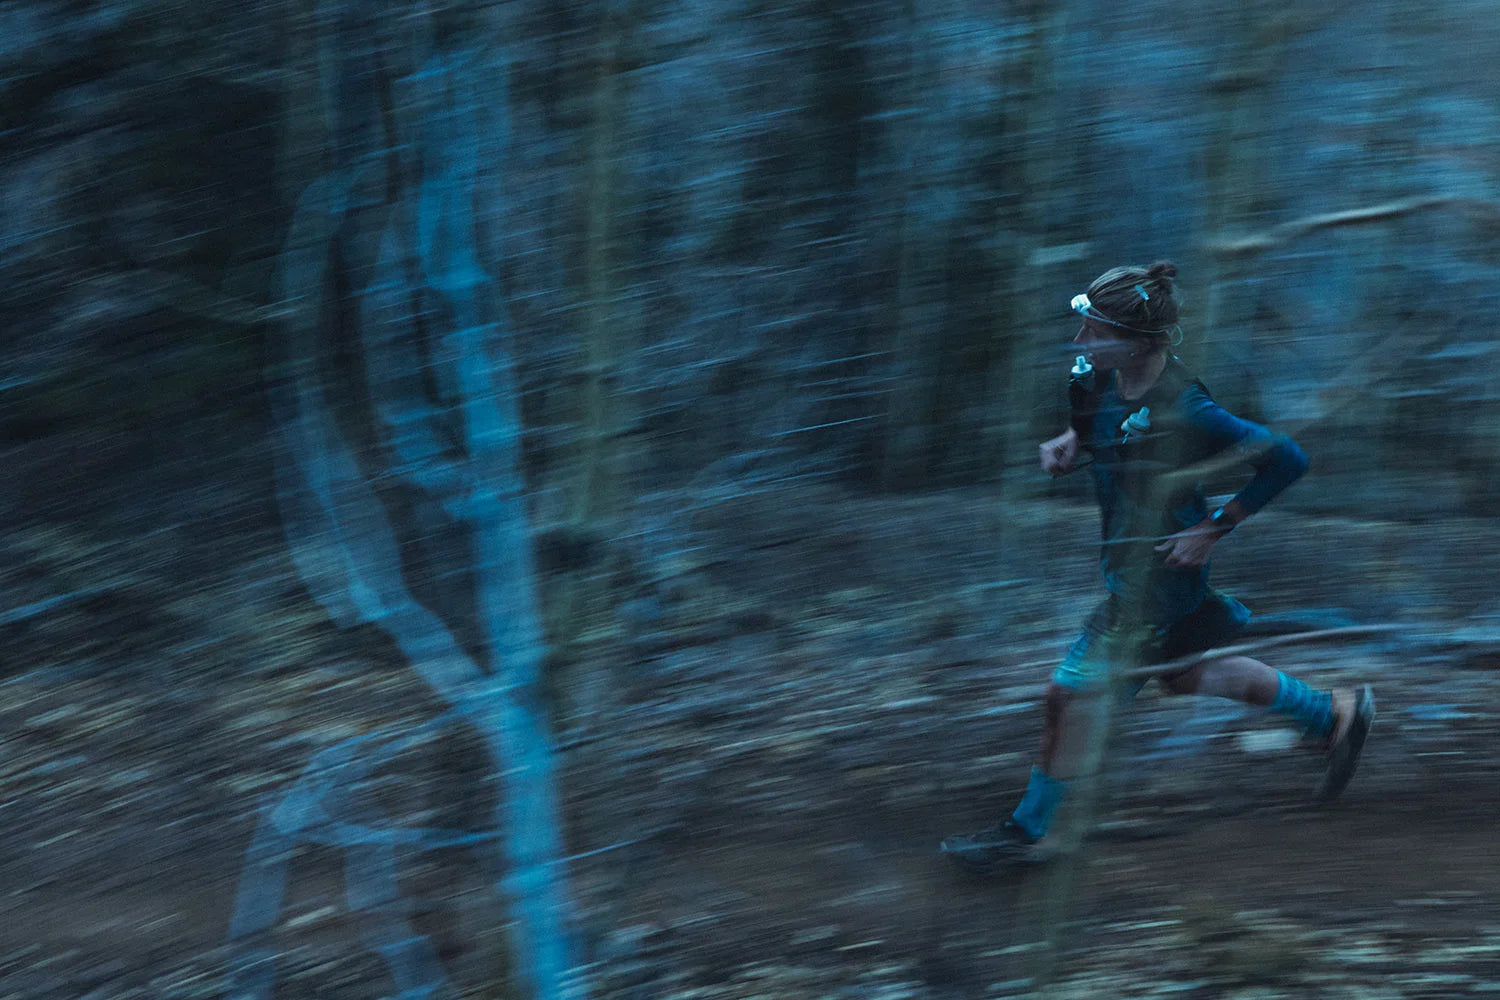
Entering the "pain cave" is familiar territory for ultra and trail runners, where discomfort and exhaustion push you to your limits. How you handle this phase can make or break your race.
Right foot, left foot: Staying driven in the pain cave
Courtney Dauwalter, one of the greatest in the sport of ultra running, excels in this arena with her unmatched mental toughness. She breaks down races into manageable sections, focusing on the next milestone, and uses positive self-talk to stay driven. Phrases like "embrace the pain" and "right foot, left foot" are her go-tos, working like mantras to keep her focused, manage pain, and maintain a steady rhythm.
“Believe is a mantra that I use pretty often,” says Courtney. “If you just repeat it over and over in your head, there’s no room for anything else but to believe that you can keep on going no matter what it looks like.” When she enters the "pain cave," Courtney imagines “grabbing a chisel” and pushing further into that mental space, a place she describes as essential to building resilience.
A bright spirit in the dark moments
What really sets Courtney apart is her infectious joy and vibrant personality. She’s often seen smiling, exuding energy, and decked out in colorful gear, reflecting her passion for the sport. This positive outlook not only helps her find joy in the grueling moments but also uplifts those around her. Embracing the pain while staying happy and colorful is Courtney’s signature approach, turning ultra running into a true celebration of endurance and resilience.
“When the sun sets at an ultra, it feels pretty special,” she shares. “It’s like you’re doing something not everyone else is doing. Sitting on your couch would be easier, but here you are, headed into the mountains in the dark to see what you can find.” And when she makes it to dawn? “Sunrise is this huge jolt of energy—like we made it through the night, and now we get to see the terrain again!”
Colorful, resilient, and ready: The Courtney-approved Suunto
It’s this positive burst of energy that brought Courtney and Suunto’s design team together to collaborate on a watch that reflects her vibrant style and unique approach to ultra running. Inspired by Courtney’s philosophy of embracing challenges with joy and resilience, the new Suunto Race S Titanium Courtney design is more than just a sports watch; it’s a companion designed together with Courtney to empower athletes to conquer their own "pain caves" and honor their resilience.
Courtney made sure the watch matched her ultra-running needs: “When I’m running 100 miles, what kind of friend do I want on my wrist? Something lightweight, easy to read, and colorful enough to give off good vibes!”
Suunto Race S Titanium Courtney:
High-definition AMOLED screen
Battery life 120h (good GPS) / 30h (Best GPS)
The lightest watch (53 g) in the Suunto portfolio
Glow-in-the-dark strap
HRV recovery measurement
Advanced training metrics
95+ sport modes
Free offline maps
Shop Suunto Race S Titanium Courtney here
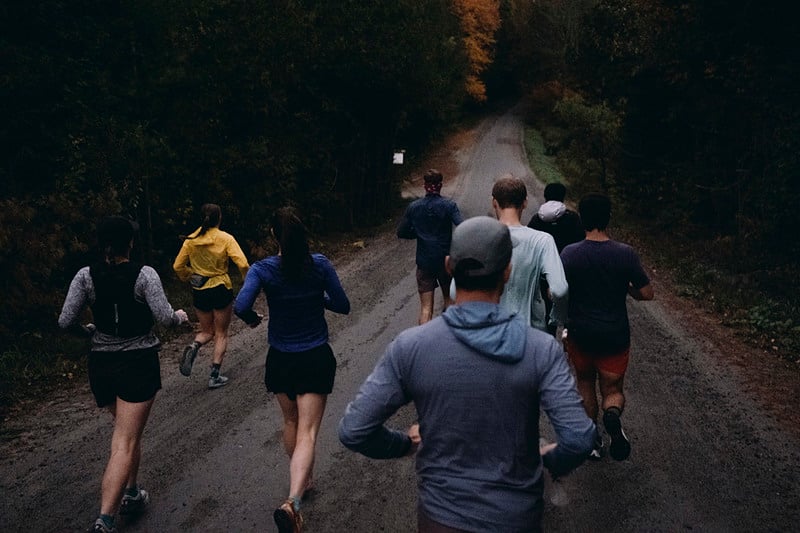

Running with purpose: Footprints Camp inspires climate action
Trail runner Dakota Jones shares his perspective on the deep connection between trail running and environmental responsibility. In this piece, he explains how his Footprints Running camp empowers runners to create meaningful climate action in their communities.
Article by Dakota Jones
One of the best things about running is that you can do it almost anywhere. As long as you have some shoes and a few clothes, you can go for a run wherever you are. (And hey – you don’t even really need that stuff, depending on the context.) Trail running was born out of this desire to embrace the experience of running and its simplicity. But this pursuit is at risk due to climate change, which is impacting not only our ability to run but the general human ability to continue to use natural resources for life, health, and prosperity. It’s a big bad scary thing and I spent too much time worrying about it and not enough time trying to do something. In 2021, I decided to change that.
I am Dakota Jones, a professional trail runner from Utah who has been running competitively for 15 years. I’ve also been trying to use my platform to address environmental issues for a long time. In 2016 I took a cargo ship across the Atlantic to race in Europe instead of flying. And In 2018, I rode my bike from where I was living in Silverton, Colorado to the Pikes Peak Marathon. Then I ran the race, and the following week I biked home.
Both of these trips were exciting adventures, and on paper they saved resources. But the problem was that neither of them was repeatable on a large scale People with jobs and families simply can’t take the time and money to travel by cargo ship or bicycle. These actions may not be the overall solution to climate change, but they had been effective actions for me personally, because I had a public platform as a professional runner. The question was: how could I help people create their own similar projects that made the best use of their own skills and circumstances?
A space for runners to drive impact
Footprints Running camp came out of that thought process, and out of the many conversations I had with smarter friends over the next few years. The basic ideas can be summed up as follows:
Running helps people be healthy and it brings them together
Running as a sport is a privileged thing to do, which implies you have the time and energy to attend to more than your basic needs
Many runners want to address social and environmental issues but don’t know how
We put these three ideas together and created a running camp that a) brought people together in person, b) centered the messaging of the camp around community service, and c) provided education and mentorship for environmental action. The key was that we don’t just want to raise awareness about problems, we want to create direct actions. And since we’re not all senators or the leaders of large corporations, we shouldn’t be expected to create global changes. Instead, each participant at Footprints arrives with an idea for how they want to address climate change in their community. During the camp, our mentors help campers bring these projects to life.
Transforming ideas into local impact
Abbie Sullivan is from Canandaigua, New York, a small town on a beautiful lake. During the last few years the lake has experienced periodic algae blooms, which is when fertilizer from outlying farms pours into the lake and consumes all the oxygen in the upper waters, making it toxic. Abbie had studied the issue during her engineering degree, but she didn’t know how to bring about action on the issue.
Her mentor was Dr. Ryan McClure, a climate scientist (and ultrarunner) from Colorado. Together they worked to develop a race in Canandaigua that brought the community together around the issue. First they identified an action to take: they partnered with a local nonprofit working on the lake’s water quality. Next, they reached out to local businesses and created a festival to partner the race. The event became an opportunity for people from all over the region to come to Canandaigua for the race and to get to know the community. Local businesses benefitted, and the runners got to race down the town’s main street. In this way, Abbie and Dr. McClure turned an environmental problem into an economic solution: now the town can see the benefit of cleaning up the lake, and they have a clear partner (the race and the local nonprofit) to whom they can turn for help.
Abbie’s project is one of more than two dozen that we have helped develop during the past three years of Footprints camps. If you want to read more, check out our website here. This fall, our fourth camp took place in northern Vermont, and we were proud to expand both our scope of education and our network of partners. During the last year we have adjusted our mission to focus on climate justice rather than simply climate change, with the aim of prioritizing the people most affected by climate change to help reduce the impacts they feel and assist them to be more prepared.
In addition, we’re thrilled to partner with Suunto! Suunto is a watch manufacturer from Finland that has been operating for more than 80 years. They began by making compasses, and now they make state of the art smart watches that allow athletes and adventurers to travel to the most remote parts of the globe without ever being lost. Suunto supports environmental activism within their own brand and externally, by providing funds and products to organizations like Footprints. We’re thrilled to share this new adventure with them and excited to tell the tale.
If you want to get involved with Footprints, take a look at our website and follow along on social media. We’ve found that when people have the support they need, they can do amazing things. As a nonprofit with a large and growing network of mentors and collaborators across many professional fields, we are excited to organize more camps and create more opportunities for people like you. What kind of project would you like to work on at camp? Reach out and tell us now!
Images by Ryan Thrower & Freetrail
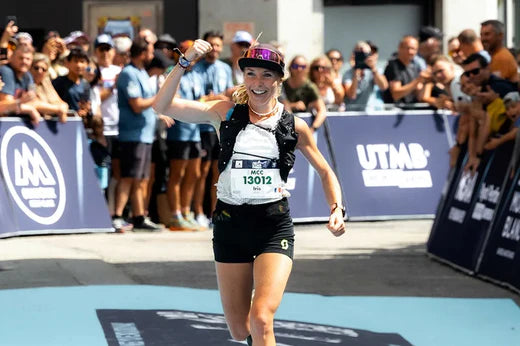

Pace your race with Abby, Iris and Dakota
Suunto athletes Iris Pessey, Abby Hall, and Dakota Jones reveal their pacing strategies during the UTMB Mont Blanc in Chamonix.
Race tactics! How should you approach a trail race to get the best possible outcome? How do you pace a race right?
We turned to three of our ambassadors – Abby Hall, Iris Pessey, and Dakota Jones – to get their tips. They each ran different distances at the UTMB Mont Blanc this year: Iris flew through the MCC, Dakota tackled the CCC, and Abby took the UTMB by its horns.
In the video below, Iris, Abby and Dakota share their unique insights on balancing effort, conserving energy, and navigating the mental and physical challenges of ultra-distance racing.
Abby uses her Suunto watch's Climb Guidance to pace climbs and descents evenly, while Dakota, a strong climber, pushes harder on uphills, saying, "Racing is about taking risks." Iris breaks her race into sections, allowing her to mentally reset along the way, finding motivation in in each checkpoint.
Curious about how the pros pace themselves in tough trail races? Watch the video now to gain valuable tips on skill, strategy, and resilience that could make all the difference on your next trail race!


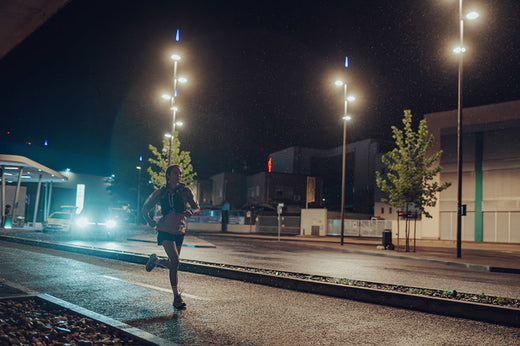
Suunto Commuting Day: Doing good one commute at a time
Last week, Suunto users around the world came together for the Suunto Commuting Day in an effort to do good for the planet. Here’s a snapshot of what the global community achieved!
Small, everyday choices are the beginning of change. One single commute may not seem like much, but over time, it all adds up. And when we look at the entire Suunto community, we can see that together we can make a bigger impact!
The combined CO₂e savings for the participants on Thursday, October 24 were over 65,000 kg. This collective effort shows that even small changes in our daily routines can have a real impact.
65,000 kg of CO₂e is equal to about 260 one-way flights from Paris to Berlin, where each passenger's emissions are around 0.25 metric tons for the 1.5-hour trip. It is also similar to the CO₂ absorbed by around 1,300 trees over ten years (based on Tree-Nation’s Eden Reforestation Projects in Mozambique). 65,000 kg is also equal to the emissions of 5,500 Finland-made Suunto Ocean watches generate during their whole lifespan.
Half on bikes, half on foot
Our data revealed that 49% of participants chose to cycle, 31% to run, and 20% to walk their commutes — each step and pedal turn contributing to both personal health benefits and a greener future. Whether on wheels, on foot, or even other creative methods, our Suunto users took meaningful action to reduce their carbon footprint.
Distances covered and time invested
Cyclists typically commuted around 7.9 km per trip, spending 28 minutes on average.
Runners tackled 6.1 km per commute, taking 40 minutes on average.
Walkers covered 2.7 km on average, enjoying 35 minutes outdoors.
The bike commute distances are distributed quite evenly over different distances: roughly a third is less than 5 km, a third is between 5–10 km, and a third is over 10 km. The longest commuting rides last Thursday were over 100 km.
Top commuting champions by country
Our Swiss users led in cycling distances with an impressive 10.3 km being the most typical commuting distance, while runners in China topped the charts, typically covering 7.5 km per commute.
Globally, France took first place for the total distance covered by its participants, followed closely by Finland, Germany, Spain, and China.
Suunto’s Commuting Day is a testament to what’s possible when people come together for a common goal. These statistics show that, collectively, we’re reducing emissions, embracing healthier lifestyles, and setting a precedent for sustainable commuting worldwide.
Thank you everyone for participating in the Suunto Commuting Day and also the photo contest. Winners of the Suunto Wing open-ear headphones have been contacted directly.
Please remember that our small everyday choices make a difference over a longer period of time and together with the community. Keep up the good work!
Learn more about tracking human-powered commutes and your CO2e savings
Learn more about Suunto sustainability work

Join Suunto Commuting Day 2024 and fight CO₂e emissions together
Brave the weather (or simply enjoy it if the conditions are good) and join us for Suunto Commuting Day on October 24, 2024!
Small, everyday choices are the beginning of change. One single commute may not seem like much, but over time, it all adds up. And when we look at the entire Suunto community, we can see that together we can make a bigger impact!
On Commuting Day, track your human-powered commute with your Suunto device and tag it as a commute. After the event, we'll calculate how much CO2e we saved together!
Tracking CO2e savings with the Suunto app is simple: ride, run, or walk from point A to point B and save your activity. The Suunto app can automatically tag one-way trips that start and end at least 500 meters (0.3 miles) apart as commutes. If you don’t have auto-tagging on, you can enable it in the Suunto app settings ('Settings' > 'Tags'). To manually tag your commutes, go to the activity, select 'Edit', 'Add tags', and choose 'Commute'.
The reduced CO2e emissions for a single activity will be shown in the workout summary. Your monthly total for CO2e savings can be viewed in the commuting widget on the app’s home page.
You don’t even need a Suunto watch or a Suunto-compatible Hammerhead bike computer to start tracking your human-powered commutes – you can also use the Suunto app for free. Download the Suunto app for iOS here or for Android here.
Learn more about tracking human-powered commutes and your CO2e savings
Share your Commuting Day activity with Suunto app for a chance to win Suunto Wing open-ear headphones!
Share your Suunto Commuting Day activity on Instagram via the Suunto app and tag @suunto for a chance to win Suunto Wing open-ear headphones! Open-ear headphones are ideal for urban commutes, allowing you to listen to audio while still hearing your surroundings.
To share your commute, add a photo to your activity in the Suunto app and include the CO2e savings data for your commute. Three of the most inspiring posts shared between October 24 and October 27 will win Suunto Wing open-ear headphones. (Terms and conditions apply. Learn more here.)
Learn more about sharing with Suunto app
Calculating saved CO2e emissions
CO2e demonstrates the global warming potential (GWP) of all six greenhouse gases in one number. We calculate your emission reduction by comparing cycling, walking or running to driving your car.
About the calculation
CO2e (Carbon Dioxide Equivalent) emissions of travel by car (average of a petrol/diesel powered car). Emission factor: 0.166867 kg CO2e/km. CO2e demonstrates the global warming potential (GWP) of all six greenhouse gases: CO2, CH4, N2O, HFCs, PFCs, SF6, NF3 in one number. Data source: Govt of UK, Dept. of Business, Energy & Industrial Strategy, 2023.
Committed to be better
Learn more about our sustainability efforts here. We know we are not perfect, but we are committed to be better.


