


Suunto Blog


Big results from World Vertical Week 22
After the fall edition of World Vertical Week 2021, we were wowed by a 43% jump in participation, but now we are blown away again because we’ve had a 79% participation increase in this edition of World Vertical Week. That means there’s been a 155% increase over the last year. What’s going on people? Can’t get enough of those hills?
As we do after every edition of World Vertical Week, we have collected the data, drilled down into it, and looked at who climbed the most and what sports gained the most meters. Read on for the results!
Participation
This edition, 125,000 people participated. That’s up from 70,000 in the 2021 fall edition, and up from 49,000 in the 2021 spring edition. We’re really impressed by this and wonder if the big increase is because, post-pandemic, races are happening again and more of us have signed up and want to get back into focused training.
Big performances
We discovered 86 people in the Suunto community climbed more than 10,000 m of ascent over the week. That’s up from 59 in fall 2021, and only nine in spring 2022. Well done you hardcore vert chasers!
There were 301 activities recorded that involved more than 3,500 m of ascent. Those are big days out - nice work! During the 2021 fall edition there were only 218, and only 89 in spring 2021. The only way is up!
For activities with more than 2000 m of ascent there were 1,183 activities recorded and 7,287 activities recorded that involved more than 1000 m of ascent.
Number of activities with more than 1000 m of ascent by activity
Ski touring: 2197 (30%)Trail running: 1993 (27%)Cycling: 767 (11%)Running: 682 (9%)
Number of activities with over 2000m of ascent by activity
Trail running: 354 Ski touring: 290Running: 167Cycling: 134
Austria remains on the throne
Once again the alpine nation has come out on top for the highest average ascent per country. This time it’s average was slightly lower than previous edition, but still neck and shoulders above second place winner, Italy. Austria has held first place in this category for six of the last seven editions. It only lost its crown in 2019, falling to fifth place. It also deserves kudos for coming in the top five of five other categories!
Go Italy!
Italy deserves some love for coming in second place in seven different categories, including the highest average and total ascents per country. Ski touring, mountaineering, trail running, mountain biking, hiking and cycling - Italy recorded the second highest average ascent per country for all of these sports. Mama mia!
Average ascent per country
Total ascent per country
Spain
Italy
France
Austria
Average ascent by activity type
Top 5 nations in different activity types
Ski touring
The average ascent for all countries was 916 m.
Switzerland, 1102 m
Italy, 1015 m
France, 1003 m
Austria, 955 m
Germany, 950 m
Mountaineering
The average ascent for all countries was 645 m.
Austria, 839 m
Italy, 753 m
Germany, 734 m
Poland, 714 m
Japan, 676 m
Trail running
The average ascent for all countries was 437 m.
Japan, 978 m
Italy, 664 m
Portugal, 617 m
Malaysia, 590 m
Slovenia, 558 m
Mountain biking
The average ascent for all countries was 359 m.
Switzerland, 523,5 m
Italy, 523,1 m
Slovenia, 487 m
Austria, 476 m
Spain, 454 m
Hiking
The average ascent for all countries was 225 m.
Malaysia, 457 m
Italy, 434 m
Slovakia, 418 m
Croatia, 412 m
Japan, 382 m
Nordic skiing
The average ascent for all countries was 185 m.
Slovenia, 410 m
Czech Republic, 369 m
Austria, 291 m
Poland, 282 m
Germany, 264 m
Cycling
The average ascent for all countries was 181 m.
Spain, 406 m
Italy, 373 m
Portugal, 309 m
Switzerland, 276 m
Slovenia, 269 m
Running
The average ascent for all countries was 95 m.
Bulgaria, 202 m
Ireland, 180 m
New Zealand, 168 m
Switzerland, 154 m
Chile, 149 m
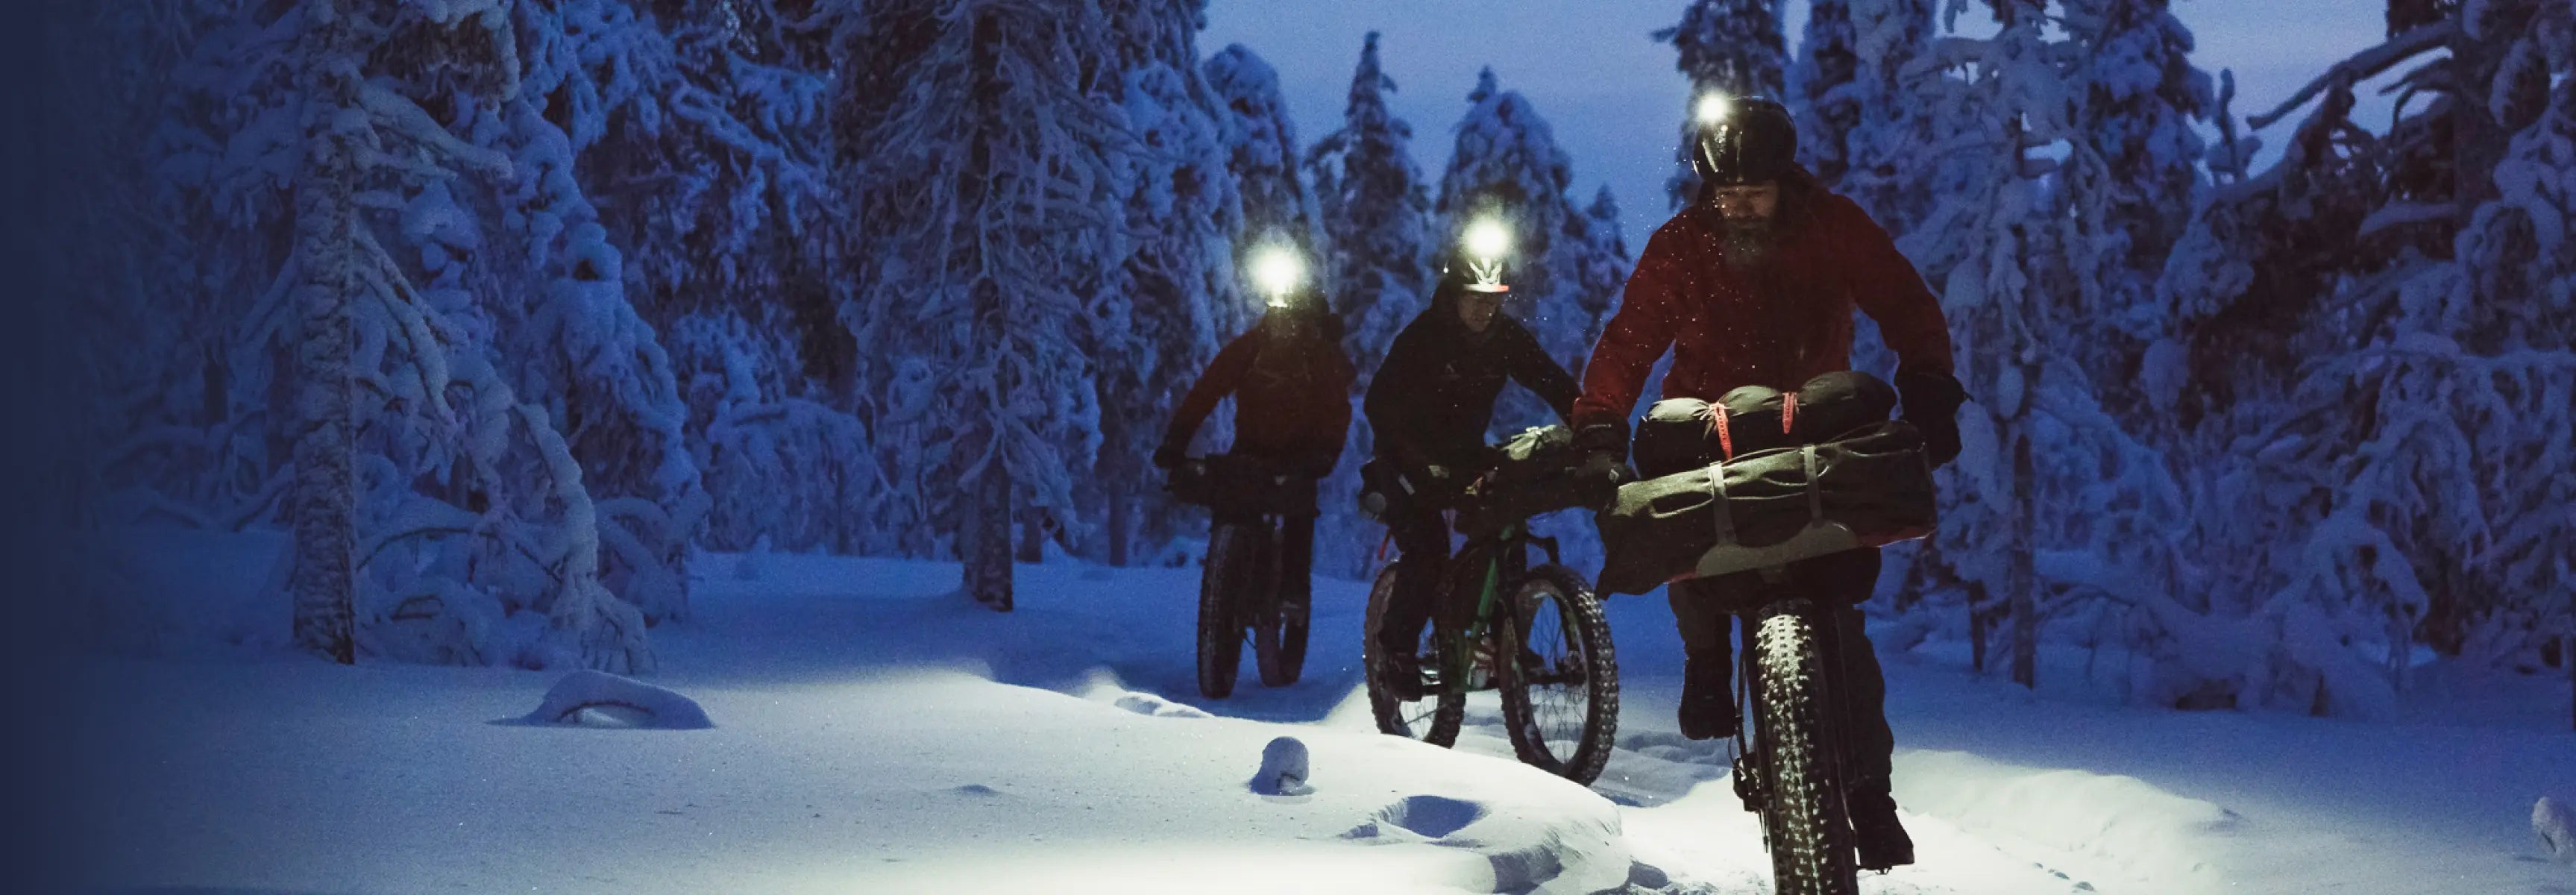
Lead image: © Philipp Reiter

10 Suunto features for vertical gain
From cycling to mountaineering, whatever your favorite outdoor sport, one thing we all have in common is the love and loathing of long, grueling ascents. They are immensely satisfying, give us a sense of achievement - and the incredible views that make it all worthwhile - and also smash us to pieces.
Suunto GPS watches come packed with intelligent features designed to help you on your long, arduous climbs. Read on for 10 features to support your vertical efforts.
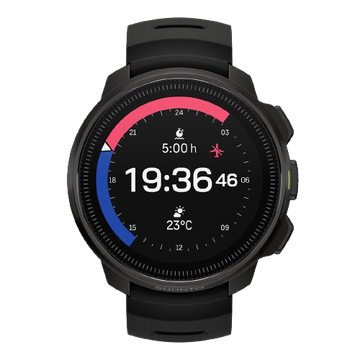
Know your altitude
Suunto Vertical, Suunto Race, Suunto 9 Peak Pro, Suunto 9 Peak and Suunto 9 Baro use barometric pressure to measure altitude. To get accurate readings, you need to define an altitude reference point. This can be your current elevation if you know the exact value. Set your reference point from the settings under ‘Outdoor’.
Alternatively, you can use FusedAlti to set your reference point automatically. The FusedAlti™ provides an altitude reading that is a combination of GPS and barometric altitude. It minimizes the effect of temporary and offset errors in the final altitude reading.
Suunto 5 Peak and other GPS watches that don’t have a barometer use GPS to measure altitude. Under optimal signal conditions, eliminating potential errors typical in calculating GPS position, the GPS altitude reading should give a pretty good indication of your elevation. If you need good elevation readings, ensure your GPS accuracy is set to Best during the recording.
Follow your route’s altitude profile
If you are navigating a route that has altitude information, you can also navigate based on ascent and descent using the altitude profile display. While in the main navigation display (where you see your route), press the middle button to switch to the altitude profile display.
The altitude profile display shows you the following information:top: your current altitudecenter: altitude profile showing your current positionbottom: remaining ascent or descent
See your vertical speed
Vertical speed is a great way to measure your pace in the mountains. Set vertical speed as one of the data fields in your preferred sport mode in Suunto app. (Here’s how to customize your sport modes.)
Comparable to running pace on a flat surface, vertical speed takes into account only the altitude as a means of measurement. It’s a really useful performance indicator because it’s a direct measurement of how fast you’re going uphill.
Vertical speed is a great way to pace an effort in an uphill lap. This also helps you estimate how long the climb will take for you – if you know the total ascent. The vertical speed is shown as meters per minute or meters per hour (or alternatively ft/min or ft/hr).
Monitor your Normalized Graded Pace
The Normalized Graded Pace (NGP) feature calculates your pace based on GPS location information that takes into account the changes in grade and intensity. NGP really shines as a feature when applied to calculating your pace on undulating or hilly terrain. Like a cycling power meter, NGP tells runners or speed hikers how much power is going into their workout.
Boost your hill training with SuuntoPlus Climb
Hill repeats are an essential part of an outdoor athlete’s workout repertoire. To make the hard work pay off, pacing is key. SuuntoPlus™ Climb feature does just that: it gives you real-time insights on your effort and motivates you to keep going.
The same goes for longer hikes, too: once you learn what kind of ascent speeds are sustainable for you, you can use this feature to pace your way up accordingly.
To use SuuntoPlus™ features on the Suunto watch, activate them before starting an activity: Select your preferred activity type and – before hitting start – go down to the options menu and select your preferred SuuntoPlus feature, like Climb. The SuuntoPlus feature you chose, will be added and available as an extra screen during the session.
Watch your intensity zones
Achieving faster ascents takes dedication and patience. As sports scientist Susi Kraft explains here, the challenging thing about improving vertical speed is hill training usually maxes out our heart rate, reducing oxygen supply and taking us from aerobic to anaerobic exercise.
With Suunto’s intensity zones, you can monitor how hard you’re exerting yourself on a climb and when you should slow it down or even take a breather. There are five different zones, numbered 1 (lowest) to 5 (highest), defined by default as percentage ranges based on your maximum heart rate (max HR).
Learn how to define your personal heart rate zones here!
Your watch screen shows you which zone you are in as your exercise. Blue represents zone one, green is zone two, then yellow, orange and red, for zones three, four and five, respectively. When you stay in the first three zones, particularly zones one and two, you are doing aerobic exercise and training your base fitness. While in zones four and five you are moving into anaerobic exercise.
Before you set out on a big climb, consider the distance and likely duration of your planned exercise, including any return trip back down. Monitor your intensity zones on the climb and make sure you don’t overdo it too soon. Ensure you have enough fuel in the tank to get back down in good form.
Review your elevation gain with Suunto app
To see a profile of the elevation you gained in a particular activity, open the activity in Suunto app and click on the map. A graph will appear that profiles the ascent and descent. You can then select your heart rate or pace, as examples, to layer over it.
To analyze your workouts on a bigger screen, give Suunto app a go on an iPad or an Android tablet.
Plan your route with 3D maps
To get a better sense of the sort of vertical challenge a route might be when you’re planning it Suunto app, switch from 2D maps to 3D maps. Zoom in and move around to get a lay of the land and to design a route with as much elevation gain as you can handle!
View and share 3D animations
With 3D video animations in Suunto app, you can watch an activity as a short animation that gives a better sense of the terrain. Proud of your effort? Then share a link to the activity with friends or family and they will be able to see the 3D animation as well – even on the big screen. To share an activity, tap the sharing icon and select ‘Share link to activity’. Add a description and photos to enhance the experience and to tell the full story.
Have a backup with SuuntoPlus Safe - My Location
If you’re heading out into alpine or mountainous terrain, safety is paramount. Weather in the mountains can change abruptly and a relatively minor injury at altitude can present a serious risk of exposure.In the event something goes wrong up there, the SuuntoPlus Safe - My Location feature provides crucial information to rescue teams. It provides location info and the direct distance and altitude from the starting place. Consider it a back up.
Images by Philipp Reiter


Running is ours to define
Suunto ambassador Lucy Bartholomew has competed at the highest level, landing the top podium spot at a number of ultra races. In 2021, she set an FKT on Australia’s 231 km Larapinta Trail and that same year published a vegan cookbook for athletes. She’s 25-years-old. So young, so many incredible achievements and experiences, and so many more waiting.
Since the pandemic began, Lucy, like all elite athletes, has had to adapt to a radically different sport landscape. For more than a month, due to a lockdown in Melbourne, she couldn’t run further than five kilometers from her front door. The experience has been a blessing in disguise, forcing Lucy to re-evaluate her relationship with running and her vision of life.
But adversity and change shape us and cause us to adapt and flourish in new and sometimes unexpected ways. Lucy is just getting started.
Photo by Andy Lloyd
By Lucy Bartholomew,
Dear ladies of the land,
What an honor it is to be here, to be a part of something special and memorable. Life.
To use our eyes to see the hidden corners of the world, our feet to lift and strike the ground beneath us, our lungs to take in the air and all that it holds and our smile to share with a stranger, a friend, a moment or the sun.
Today is International Women’s Day. A day marked to raise the awareness of the women and those that identify as such and all that we bring to the world.
In sport and in running there is a shift happening; a change in the tide that is building and gaining momentum that is exciting and scary depending on the direction it flows. There is a hopeful push towards embracing not only your WHY in sport, but also the WHO you are and the HOW you do it.
No longer are we being told there is only one way to be an athlete.
There’s no minimum pace required to be a runner.Or a minimum distance you must cover.A maximum weight permitted to do the sport.An acceptable clothing size you should wear.A ‘way’ you should look when you run.
We are starting to realize we decide what we want to do with this sport; go professional? Make it a hobby? Run around a track, or climb a mountain? Never pin a bib on or race constantly? Use it to commute to work and nothing more, use it to keep up with the kids or to explore a new area. Whatever your reason, it is valid and it is worth pursuing.
We, this collective of the incredibly lucky human race that has found sport and running, are stronger than we will ever know. We are already breaking down walls we thought were made of bricks, but actually were merely just some tangled vines of perceived boundaries of what we are capable of and we are starting to cut them back one by one.You are vital to this process, you are contributing. Every time you put your shoes on and go for a run, no matter what talk is going on in your head never let it strip you of your pride and strength in the act of running that you are participating in.
Never overlook the fact that people you see you out running - someone walking past you, or someone in a car, stuck in traffic or driving by, or a child walking home from school - might notice you and feel inspired, see your strength, your beauty and start to wonder.
We don’t get just one day of the year to celebrate women, we get our lifetimes. We celebrate others; our friends or our competitors, we celebrate mother nature and we celebrate and respect anyone in any corner of the world, in any life situation having the courage to put their shoes on, leave the comfort of their home and enter the unknown.
We don’t know what we will see, what we will hear, smell, or what it might inspire while we’re out there. We don’t know how we are going to feel, how the weather will be, or what the route might look like that day. What I do know is that the unknown is full of potential. YOU are full of potential and YOU have the potential to help others to realize theirs.
You are powerful, you are strong, you are worthy and you are needed.
Fellow lady boss,Lucy B
Lead images:
© Marty Rowney
© Andy Lloyd
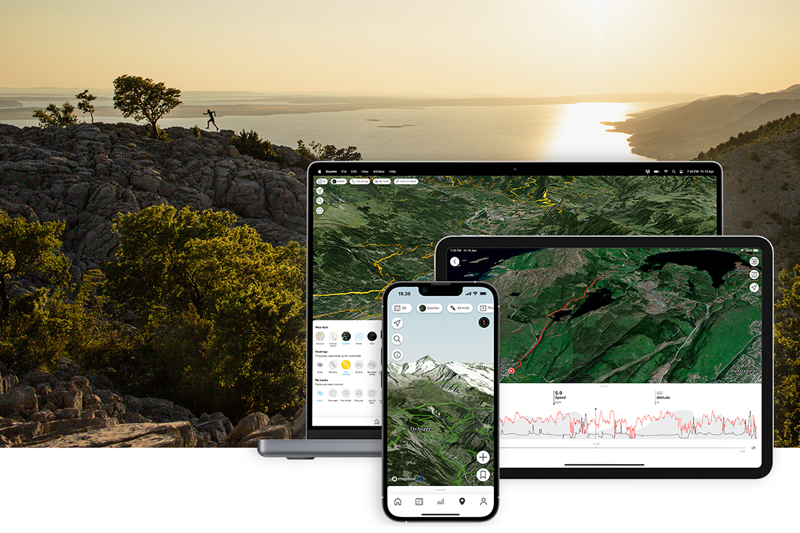

Suunto app goes big!
Suunto app is now compatible with iPad and Android tablets. You can find the app for your big screen iOS device in App Store and in Google Play for Android devices.
Here are some tips, tricks, and benefits of using Suunto app on a bigger screen!
Update: In addition to iPads and Android tablets, you can also use Suunto app on Mac computers with M1 and M2 processors!
Plan routes
A big screen is great for route planning. Use different map layers, switch between 2D and 3D and get inspiration from our sport-specific heatmaps.
To sync your routes to your watch, you don’t need to pair your watch with the tablet: Once saved, the routes are uploaded to the cloud and automatically synced to your watch the next time you open Suunto app on your phone.
View in 3D
To get a good view of your – or your friends – adventure, play a 3D animation of the activity. Simply go to your activity, hit the play button, and enjoy the views!
And hey, you can also share a link to your activity with your friends and they will be able to see a 3D animation of it on a web browser. To share an activity, tap the share icon and select ‘Share link to activity’. Add a description and photos to enhance the experience and to tell the full story.
Analyze your workouts
Analyze your activities in detail with maps and workout graphs: simply go to the activity, click map and you will enter a view with editable workout graph. You can select the data you see in the main graph, comparison graph and the background graph. Tap a point on the graph and drag to move. Turn the device sideways and you will see the graph in more detail!


12 high-intensity strength training exercises for endurance athletes
Follow our training video and SuuntoPlus Guide to get stronger.
In our previous article on why endurance athletes should do high-intensity strength training, sports scientist, coach and ski mountaineer Susi Kraft lay out five reasons why it is essential. In this article, Susi explains and demonstrates how to perform 12 strength building exercises. Press play on the video below and scroll down for her instructions on how to perform each exercise correctly and safely.
Follow this strength training session on your Suunto!
With the help of SuuntoPlus Guides, you can also follow this strength training workout on your Suunto watch. Before starting a 'weight training' workout on your watch, go down to exercise options and select ’12 Strength Exercises’ from the SuuntoPlus Guides menu. Start the workout and you will see step-by-step guidance on one of your watch screens. Swipe left until you see it. Press lap (lower right button) to advance from one step to the next one. Watch the video, activate the strength training guide for your workout and get to work. Time to get stronger!
Learn more about SuuntoPlus Guides here.
If you are new to strength training, keep in mind it’s better to begin using your own body weight to begin with and to find a trainer who can personally show you how to do the movements with proper form.
By Susi Kraft
Lifting heavy weights not only improves your performance as an endurance athlete, but done regularly, it also helps to avoid acute and overuse injuries caused by repeated loads while downhill running or skiing, for example.
Learn to perform the 12 exercises below with the proper technique and you’ll boost your vertical power and endurance!
Before you start
Make sure you develop a baseline of strength before you start lifting heavy loads. This can be achieved via exercises performed with your body weight only. Developing core strength is an essential preliminary to moving on to heavy weights. Without it, you risk injury. Once you have a decent level of base strength, perform the exercises below with a focus on technique and a lighter weight. Only increase the weight when you have good control.
What is heavy resistance training
Heavy resistance training aims to optimize your maximum strength and explosive strength. It’s one of the most effective forms of strength training. Performed regularly it will let you gain strength much faster than body weight exercises.
How and when to train
Endurance athletes normally have plenty of time for strength training during the off-season or during the base training phase. For example, as a trail runner you can use winter to prepare or as a skimo athlete you can make summer and early autumn your time to build strength.
I recommend dedicating about two months for intense and specific high resistance training. Try to complete two sessions per week.
All big muscles should be targeted
Focus on complex, full-body exercises
Train with high loads and few repetitions
Eight to 12 repetitions
Three sets
Two minutes pause between sets
At least two days off between strengths training sessions (endurance sessions possible)
How much weight to choose
High resistance training is performed at about 80 % of your one-repetition maximum (1RM). If you don’t want to test out your 1RM for each exercise (as that is really intense and requires a perfect technique already) you can just use a weight that allows you to perform a maximum of 8 to 12 repetitions.
Which exercises to choose
Upper-body and lower-body exercises.
Choose multi-joint exercises (such as a squat), exercises capable of heavy loads (such as a deadlift), and exercises that focus on power development (such as a box jump).
Also choose unilateral (one leg exercises such as split squats or step-ups) and bilateral exercises such as deadlifts.
Now let us introduce you to the most important strength exercises for endurance and mountain athletes. You don’t have to perform them all every time, but make sure to choose exercises in an order just described.
12 strength exercises for endurance athletes
WARM UP
15 minutes of cycling, rowing or treadmill running
Dynamic sretching (especially ankle, hips, spine, shoulders)
5 x 30 seconds skip rope
If you like you can also perform some easy core exercises or a brief cross fit workout – just make sure not to push too hard.
Strength training exercises
Box jumps
Abduction
Bulgarian split squats
Pull ups
Squats
Push ups
Step ups
Deadlifts
Heel raises
Romanian deadlifts
Barbell row
Single leg hip thrusts
Box jumps
Box jumps are great for developing power through the lower-limb extensor muscles.Stand tall with a box (40 to 60 cm high) in front of you with feet hip-width apart and arms by your sides. Now bend the knees and immediately move back up.
Jump onto the box as explosively as possible. Try to land gently on both feet and extend your hips and knees on top. Step down and repeat three sets of five to eight repetitions. Try to make each jump good quality in terms of technique and form. Remember to always perform jumps at the beginning of your workout, as they are most demanding.
Abduction
Use a stretch loop or elastic band. Wrap it around your thighs or lower legs (which is more demanding). Shift your weight to one leg and try to stand stable while extending the other leg out to the side. Do two sets of 12 repetitions for each leg.
Bulgarian split squats
Stand in lunge position. Heighten one leg on a box. Lower your body by bending the front leg to about 90° knee angle and slowly get up again. Use a kettle bell, two dumbbells or a barbell to add weight. Make sure your front knee does not shift out to either side while going down and up.
Pull ups
With hands shoulder width apart, begin by hanging from a bar with arms fully extended. Pull yourself toward the bar with your chin clearing the bar. Lower yourself slowly and repeat. If you can’t perform a single clear pull up you can use resistance bands to support yourself.
Squats
Put a barbell on your neck/shoulders/upper back. Squat down as far as possible (maintaining a stable spine). Push back up. Always keep the barbell over your middle foot and the pressure distributed over your whole sole. Focus on your knees (mirror). They should never shift to medial.
Push ups
Start with hands shoulder width apart underneath your shoulders. Lower your chest to the ground and push back up. Keep your body stable and make sure not to bend your lower spine. If you can’t perform a single push up on the ground use a box or table to base your hands on.
Step ups
Step on a box that's about the same height as your knees. Stand up straight and step back down. Repeat eight to 12 times for each leg. Use two dumbbells or a barbell to add weight. Make sure to keep the pelvis level throughout and focus on your glutes and quads as you step up.
Deadlifts
This exercise strengthens the quadriceps, hamstrings and glutes and also addresses your upper body stability.
Stand behind a barbell on the floor with your feet hip-width apart and the bar over the centre of your feet. Bend the hips and knees to grip the bar.
Keep your chest up, hips back, stand stable on both feet. Make sure your lower back remains neutral by activating your abdominal muscles.
Pull the bar up close to your shins and extend your knees and hips simultaneously and explosively. Push through your heels, lift the barbell straight up and drive your hips forward as you lift. Always keep your arms straight; weight is lifted by getting up out of your legs only.
Hold the upper position for two seconds.
Return the bar straight down to the floor by flexing your hips and knees slowly.
If you are new to this exercise, perform three sets of 10 to 12 reps with a light weight. To progress, increase the weight and reduce to three sets of six to eight reps. In case you are uncertain, perform the exercise under the guidance of a sports therapist or strength coach.
Heel raises
Stand on a box or a stair with your feet hip width apart. Raise your heels up while keeping your knees straight. Slowly lower your heels underneath the edge of the box. Rhythm: one second up, three seconds down. Use two dumbbells to add weight.
Romanian deadlifts
The Romanian deadlift is a variation of the traditional deadlift.
Grip the bar shoulder width, pinch your shoulder blades together and keep your chest up. Lower the bar down to your shins by moving your hips backwards and leaning your upper body forwards while keeping the bar as close to your body as possible. Bring your hamstrings to full stretch. Return into starting position by pushing the hips forwards. Always keep your lower back fixed!
Barbell row
Grip the bar shoulder width, bend your upper body forward (up to horizontal to the floor). Slightly bend your legs and hips. Hold your spine ina neutral positon and activate your core muscles. Pull the barbell up to your belly button and squeeze your shoulder blades together. Slowly extend your arms again. Repeat. Focus on your upper body and legs to remain stable.
Single leg hip thrust
Lie down with your shoulders on a box or bench. Raise one leg up straight in the air and keep the other foot on the ground (ankle underneath the knee). Lift your pelvis from the ground until your shoulders, pelvis and knees form a straight line. Lower the pelvis down to the floor again.
All images: By Philipp Reiter at Sportssupport in Salzburg.


5 reasons why endurance athletes should do high-intensity strength training
To improve vertical speed and endurance, high-intensity resistance training (HIRT) should be an essential component of your training plan, says sports scientist, coach and athlete Susi Kraft.
One half of the Berghasen blog and training resource, Susi is concerned many endurance athletes, whether trail runners, mountaineers or cyclists, believe they can skip the gym altogether or just do a little bodyweight training and that will suffice.
“One of the most common myths in the endurance world is that athletes should avoid lifting heavy weights, as they don’t need that for endurance, or that it will cause them weight gain and may slow them down,” Susi says. “This is just a myth. Actually, HIRT will make you faster, stronger and less prone to injury.”
Scroll down for five reasons why to make HIRT part of your training plan.
Click here to watch Susi demonstrate 12 high-intensity strength exercises!
Susi is a passionate ski mountaineer. Photo by Berghasen.com
What is HIRT?
HIRT is a high intensity form of strength training that aims to enhance maximal and explosive power, Susi explains. The goal is to build the level of strength optimal for a particular sport rather than becoming as strong as a powerlifter or as ripped as a bodybuilder. HIRT involves lifting heavy loads for only a few repetitions and focusing on the quality of movement and technique. The purpose is to stimulate the muscles and other structures in the body so they become used to heavy loads. Another general rule of HIRT is to lift the heaviest weight you can maintain throughout the sets, without compromising form.
It’s backed by scientific research
A 2018 meta-analysis published in the International Journal of Sports Physiology and Performance, found endurance athletes (including runners, cyclists, cross-country skiers, and swimmers) benefitted from adding a strength training component to their training. It found athletes improved their energy cost of locomotion, maximal power, and maximal strength. Specifically, high weight, low repetition sets - HITR - were found to provide endurance athletes the best performance gains in addition to their endurance sessions.
Gets your body used to heavy loads
To continue getting faster for longer season after season as an endurance athlete, your body needs to be able to handle increased loads without breaking down. Lifting heavy weights provides exactly that by strengthening tendons, ligaments, collagen, and bone density. It gives the feedback your body needs to get used to carrying load on inclines and at distance.
Increases vertical power
Strength and power training enhances running economy, corrects imbalances, prevents injury, and increases resting metabolic rate. Furthermore, numerous studies have shown that strength training improves time-trial performance and VO2max in competitive endurance athletes. It improves movement quality, strength, and power - paramount for performance, and is important for preventing injuries.
Lessens the likelihood of injury
Being strong is one thing, but staying injury free is another. The ancillary effects of weight lifting include stronger ligaments and tendons, as well as the creation of new neural pathways, which can help you stay healthy.
Endurance sports have some of the highest rates of injury of any [professional] sport. Most of these injuries are due to overuse or ankle sprains, which can be prevented with HITR. Building up a bulletproof body will also allow you to withstand more training stress. The culmination of these two things is consistency in training, and that leads to faster race times.
Protects bone and joint health
Studies have found that weight training can maintain healthy bone density and protect our joints. As we get older, bones can lose their density and osteoporosis, a common disease, can cause them to weaken and become more brittle. HITR helps to prevent this and strengthens the supporting cast of muscles surrounding joints, resulting in less force going directly to the joint structure.
But first, establish a base
Before launching into HIRT make sure you have first established a decent level of base strength. Do not start HIRT if you haven’t done much strength training before. Instead, begin with a bodyweight training routine first and develop strength safely and gradually. To avoid injury while working out, also make sure to learn the correct technique for each exercise before you start increasing the weight.
Click here to watch Susi demonstrate 12 HIRT exercises!
Lead images: By Philipp Reiter


