




Suunto Blog

Suunto Commuting Day: Doing good one commute at a time
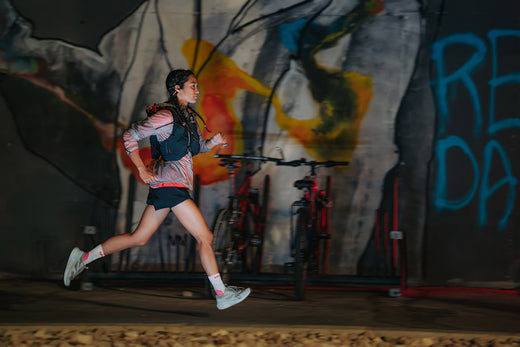
Last week, Suunto users around the world came together for the Suunto Commuting Day in an effort to do good for the planet. Here’s a snapshot of what the global community achieved!
Small, everyday choices are the beginning of change. One single commute may not seem like much, but over time, it all adds up. And when we look at the entire Suunto community, we can see that together we can make a bigger impact!
The combined CO₂e savings for the participants on Thursday, October 24 were over 65,000 kg. This collective effort shows that even small changes in our daily routines can have a real impact.
65,000 kg of CO₂e is equal to about 260 one-way flights from Paris to Berlin, where each passenger's emissions are around 0.25 metric tons for the 1.5-hour trip. It is also similar to the CO₂ absorbed by around 1,300 trees over ten years (based on Tree-Nation’s Eden Reforestation Projects in Mozambique). 65,000 kg is also equal to the emissions of 5,500 Finland-made Suunto Ocean watches generate during their whole lifespan.
Half on bikes, half on foot
Our data revealed that 49% of participants chose to cycle, 31% to run, and 20% to walk their commutes — each step and pedal turn contributing to both personal health benefits and a greener future. Whether on wheels, on foot, or even other creative methods, our Suunto users took meaningful action to reduce their carbon footprint.
Distances covered and time invested
Cyclists typically commuted around 7.9 km per trip, spending 28 minutes on average.
Runners tackled 6.1 km per commute, taking 40 minutes on average.
Walkers covered 2.7 km on average, enjoying 35 minutes outdoors.
The bike commute distances are distributed quite evenly over different distances: roughly a third is less than 5 km, a third is between 5–10 km, and a third is over 10 km. The longest commuting rides last Thursday were over 100 km.
Top commuting champions by country
Our Swiss users led in cycling distances with an impressive 10.3 km being the most typical commuting distance, while runners in China topped the charts, typically covering 7.5 km per commute.
Globally, France took first place for the total distance covered by its participants, followed closely by Finland, Germany, Spain, and China.
Suunto’s Commuting Day is a testament to what’s possible when people come together for a common goal. These statistics show that, collectively, we’re reducing emissions, embracing healthier lifestyles, and setting a precedent for sustainable commuting worldwide.
Thank you everyone for participating in the Suunto Commuting Day and also the photo contest. Winners of the Suunto Wing open-ear headphones have been contacted directly.
Please remember that our small everyday choices make a difference over a longer period of time and together with the community. Keep up the good work!
Learn more about tracking human-powered commutes and your CO2e savings
Learn more about Suunto sustainability work


Revealing Secrets of the Heart with DDFA by MoniCardi
A Technological Breakthrough from Tampere University
MoniCardi, a medical technology and software company originating from Tampere University, has been diligently developing novel and heart rate variability (HRV) methods to decode the intricate phenomena of the human body. The MoniCardi team aims to unveil the various physiological characteristics influenced by the heart's behavior, opening new frontiers in health and performance measurement.
The Foundation: Validation with Massive Datasets
MoniCardi's groundbreaking research is rooted in statistical and time-series analysis methods originally developed in computational physics. These methods have surprising, yet highly impactful applications in electrocardiography, including HRV analysis.
MoniCardi's novel methods and their usefulness have been validated in various scientific studies [1-9] and they have been featured in the leading conferences of cardiology such as the Scientific Sessions of American Heart Association. The studies include exploitation of massive datasets such as the extensive Finnish Cardiovascular Study (FINCAVAS), which contains comprehensive measurement data from 4386 participants of a clinical stress test. In a recent breakthrough study [1], it was found that MoniCardi's HRV analysis of a one-minute rest phase prior to the test predicts sudden cardiac death significantly better than the conventional analysis of the complete 20-minute stress test (hazard ratios of ~2.5 and ~1.5, respectively). The superiority of MoniCardi increases further when considering all the other risk factors in the analysis.
Outside clinical studies, MoniCardi's patented methodology allows accurate estimation of metabolic thresholds in sport applications. This was confirmed in a ground-breaking study published by the team in the leading physiological journal in 2023 [2]. The study was featured in several national and international news sites, including a full-page article in the main Finnish newspaper Helsingin Sanomat (link below). The results are currently under validation in academic collaboration between Tampere University and the Finnish Institute of High-Performance Sport (KIHU). Through a partnership with Suunto launched in 2024, MoniCardi's novel technology is now entering in the use of professional athletes, sport enthusiasts and all the consumers interested in these novel features that push the HRV analysis into a completely new level and ensure practical and actionable results.
Understanding Heart Rate Variability (HRV)
Heart rate variability (HRV) measures the variation in the time intervals between consecutive heartbeats. By analyzing the fluctuations in these intervals, it is possible to gain insights into the body's state, particularly the autonomic nervous system's influence on the heart. Conventionally, HRV has been used to gauge recovery states during sleep through RMSSD (Root Mean Square of Successive Differences), which observes nightly changes in HRV to detect stress levels. At rest, the body shows significant variability between heartbeats, known as HRV. However, as the body encounters increased stress, the autonomic nervous system shifts into the fight-or-flight mode, resulting in minimal heart rate variability. This reduction in HRV can be used as an indicator to assess stress levels.
Introducing DDFA: A Revolutionary Measurement Technology
HRV methods are conventionally split into time-domain, frequency-domain and nonlinear methods. One of the most common nonlinear methods is Detrended Fluctuation Analysis (DFA) developed in the early 1990s. The key information provided by DFA is the overall long-term characteristics of HRV in terms of correlations, in particular, how changes in heartbeat intervals at some time affect the changes at another time. This information has powerful predictive value, but the practical usefulness of this information was unleashed only recently, when Dynamical DFA (DDFA) was developed [8,9] and further refined to assess changes in HRV correlations in a time-sensitive manner [10]. In brief, DDFA utilizes a multitude of "measure sticks" from 4 up to >50 consecutive heartbeats. At every instant of time, DDFA then gives a so-called scaling exponent - a characteristic feature of correlations in heartbeat intervals - for all these measure sticks simultaneously. This information can be precisely mapped to the physiological state during physical exercise.
Real-Time Intensity Monitoring
DDFA excels in assessing real-time changes in the heartbeat correlations during exercise. Training intensity directly correlates with time- and scale-dependent variations in the DDFA scaling exponent. Research indicates that increasing intensity in physical exercise decreases the scaling exponents. Eventually, at very high intensities, the beat-to-beat intervals may show so-called anticorrelations, where large and small beat-to-beat intervals alternate in a specific manner depending on the time scale. This information allows for precise monitoring of exercise intensity and physiological thresholds.
Visualizing DDFA in Action
A pivotal study, "Estimation of Physiological Exercise Thresholds Based on Dynamical Correlation Properties of Heart Rate Variability," published in Frontiers in Physiology in 2023 [2] illustrates DDFA's capabilities. The research paper presents an exercise scenario where intensity increases over time. The cyan lines denote the two metabolic thresholds: LT1 (aerobic threshold) and LT2 (anaerobic threshold), with the black dotted set on locations where these thresholds would be based blood lactate levels.
This illustrates an ideal scenario where the DDFA-based analysis yields threshold levels nearly identical to those obtained using lactate-based threshold definitions. While this represents the optimal case, variations are expected in real applications. The DDFA analysis and lactate-based thresholds may differ from case to case, with heart rate measurements typically matching within +-5 beats per minute. There are also uncertainties inherent in lactate thresholds, which are subject to interpretation.
Validity up to clinical accuracy
MoniCardi methodology has been used to predict the overall cardiac risk and sudden cardiac death [1], and several cardiac diseases such as long QT syndrome [4,5], atrial fibrillation and congestive heart failure [in preparation]. The methods have also been applied to estimate stress and sleep stages [6,7]. The prediction of sudden cardiac death [1] has gained traction and it was featured in all the big news sites in Finland (YLE, Helsingin Sanomat, Ilta-Sanomat, Aamulehti) and on several international news sites (list below).
In medical technology, MoniCardi is currently collaborating with Cardiolex Medical, a Swedish MedTech company developing modern ECG devices and systems. MoniCardi is also seeking partners in wearable technologies to bring cardiac risk assessment to mass markets.
References:
[1] Jussi Hernesniemi, Teemu Pukkila, Matti Molkkari, Kjell Nikus, Leo-Pekka Lyytikäinen, Terho Lehtimäki, Jari Viik, Mika Kähönen, Esa Räsänen, Prediction of sudden cardiac death with ultra-short-term heart rate fluctuations, JACC: Clinical Electrophysiology, 2024
[2] Matias Kanniainen, Teemu Pukkila, Joonas Kuisma, Matti Molkkari, Kimmo Lajunen, and Esa Räsänen, Estimation of Physiological Exercise Thresholds Based on Dynamical Correlation Properties of Heart Rate Variability, Front. Physiol. 14 (2023).
[3] Teemu Pukkila, Matti Molkkari, Matias Kanniainen, Jussi Hernesniemi, Kjell Nikus, Leo- Pekka Lyytikäinen, Terho Lehtimäki, Jari Viik, Mika Kähönen, and Esa Räsänen, Effects of Beta Blocker Therapy on RR Interval Correlations During Exercise, Computing in Cardiology 50 (2023) 10.22489/CinC.2023.104
[4] Matias Kanniainen, Teemu Pukkila, Matti Molkkari, and Esa Räsänen, Effect of Diurnal Rhythm on RR Interval Correlations of Long QT Syndrome, Computing in Cardiology 50 (2023) 10.22489/CinC.2023.287 [5] T. Pukkila, M. Molkkari, J. Kim, and E. Räsänen, Reduced RR Interval Correlations of Long QT Syndrome Patients, Computing in Cardiology 49 (2022) 10.22489/CinC.2022.284
[6] Teemu Pukkila, Matti Molkkari and Esa Räsänen, Dynamical Heartbeat Correlations During Complex Tasks – A Case Study in Automobile Driving, Computing in Cardiology 48 (2021) 10.23919/CinC53138.2021.9662676
[7] M. Molkkari, M. Tenhunen, A. Tarniceriu, A. Vehkaoja, S.-L. Himanen, and E. Räsänen,
Non-Linear Heart Rate Variability Measures in Sleep Stage Analysis with Photoplethysmography, Computing in Cardiology 46 (2019); 10.22489/cinc.2019.287
[8] M. Molkkari, G. Angelotti, T. Emig, and E. Räsänen, Dynamical Heartbeat Correlations During Running, Sci. Rep. 10, 13627 (2020)
[9] M. Molkkari and E. Räsänen, Robust Estimation of the Scaling Exponent in Detrended Fluctuation Analysis of Beat Rate Variability, Computing in Cardiology 45 (2018); 10.22489/CinC.2018.219
[10] M. Molkkari and E. Räsänen, Inter-beat interval of heart for estimating condition of subject, Patent pending.
Latest news of MoniCardi
International news:Science Daily: https://www.sciencedaily.com/releases/2024/06/240613140808.htmScience Alert: https://www.sciencealert.com/new-algorithm-can-predict-and-help- prevent-sudden-cardiac-deathMirage News: https://www.miragenews.com/tampere-university-researchers- predict-sudden-1255528/Medical XPress News: https://medicalxpress.com/news/2024-01-method-based-series-analysis-thresholds.html
Finnish news:
YLE: https://yle.fi/a/74-20093771Helsingin Sanomat: https://www.hs.fi/tiede/art-2000009847625.htmlIlta-Sanomat: https://www.is.fi/terveys/art-2000010505400.htmlAamulehti: https://www.aamulehti.fi/tiedejateknologia/art-2000010497986.html https://www.aamulehti.fi/tiedejateknologia/art-2000009863997.htmlSTT: https://www.sttinfo.fi/tiedote/70082024/aikasarja-analyysiin-perustuva-uusi-menetelma-helpottaa-urheilun-kynnysarvojen- maarittamista?publisherId=69818730&lang=fi


Get ready for a gravel race!
Nordic Gravel Series team member, rider and coach Joonas Henttala gives his essential tips for a successful gravel race.
Joonas Henttala, a coach and a Nordic Gravel Series team member, has more than 10 years of experience in the professional peloton. In 2023, after ending his road cycling career, he turned to coaching and gravel event organizing, took up trail running as his personal challenge while also riding gravel.
We got in touch with Joonas to get some tips for a gravel race. Read on and be ready for a big, fun day out!
Progressively build your fitness
Gravel races are long and require a strong, aerobic base, which is built by spending quality time in zone 2 and later layering higher intensities and race spesific efforts on top.
Joonas says that consistency and progressively adding training load are the keys to successful endurance training.
“Riding one hour five times weekly is a better start than a five-hour smash-fest once a week. After your body starts to adapt, you can progressively add more training load. It does not make sense to do a huge hero ride way beyond your limits on the weekend and then recover from it the entire following week. The body simply can’t assimilate that and progress will be slow. The aerobic needs required in a long event or race need consistent stimulus over long periods of time.”
The slower speeds and smaller groups make the power output on gravel slightly different from the road.
“On the road there’s often more coasting and higher power peaks, while gravel riding is more grinding, keeping constant pressure on the pedals,” Joonas explains.
Get comfortable riding in a group. (Image: NGS/Falling Leaves Lahti)
Practice your bike handling
Solid bike handling skills are essential as gravel riding can get technical, almost like mountain biking. Especially if your background is in road cycling, practicing your bike handling can be very beneficial.
“If you come from the road, you may assume there’s grip everywhere. But gravel is different. You must learn to find the grip on a surface that’s moving underneath you. Practice different kinds of turns on different surfaces.”
Mountain bikers are comfortable with the varied terrain. For them, Joonas recommends getting comfortable riding in a big group. The first hour of a gravel race can be especially hectic. Still, you should be able to stay relaxed and not get intimidated by leaning on one another or touching handlebars with someone.
“Joining a few group rides before taking part in a gravel race is definitely a good idea. After a few of them, you will start to feel more comfortable,” he promises.
“Solid bike handling skills and experience from group riding help you save energy, too.”
Get to know the course
Knowing the course well is definitely beneficial. However, pre-riding the entire course is often not an option as the distances of gravel events are so long. That’s when the Suunto app comes in handy: Import the route GPX file to the Suunto app (or sync it from a compatible partner service, like Strava or Komoot) and study the course. Look at the altitude profile to identify the big climbs – and descents.
“Try to save some energy for the big climbs. That’s where the strong riders will make their moves,” Joonas instructs.
“That same applies to other parts of the course as well: Try to save energy when riding easy sections, like roads. When the riding gets more technical and the speeds slower, be prepared to hammer.”
The map in the Suunto app is a great way to identify those key sections: Look at the roads, tracks and trails. How wide are they? When is it getting technical? If, for example, a road narrows to a single track, you don’t want to be in the back of the group and stuck in a traffic jam. Take your positions early.
The fun is about to get real! (Image: NGS/Falling Leaves Lahti)
Refuel early
In a long endurance event, a steady pace would be optimal – but often far from reality in gravel races. If you want to stay in the front, the first hour is decisive: You must weigh whether you can afford to ride a little too fast in the beginning to stay with the group without bonking.
Try to also conserve energy: Draft in the group and remember to start refueling already at the beginning of the long race. If you don’t refuel during the first hour, you will have to pay for the consequences later.
“Riding should feel hard, but not so hard that after the first hour, you’ll start to question if you’ll be able to finish the race,” Joonas says.
Having the necessary energy in the bottle for the first hour might be a good idea. This way you don’t need to mess with gels and bars in the heat of the early part of the race.
Remember what’s important
People take part in gravel events with quite different approaches: some are there to win, others to test their own limits. Some simply want to have a good time on the bike and make new friends.
“Gravel races are quite different from road races. Even in the lead group people chat and have smiles on their faces. I certainly hope it stays this way,” says Joonas.
Whatever your goal, ride hard but be polite and considerate of others.
“If you cross the finish line with emptly legs and a big muddy smile on your face, the day has been successful – whatever your goal!”
Coach Henttala himself after Traka 360 in Girona in May 2024.
Learn more about the Nordic Gravel Series

Connect your Suunto with Shimano Di2 electronic shifting
Want to know what gears you use and monitor the battery on your electronic shifting? Read on and learn how – and why – to connect your Suunto with Shimano Di2 electronic shifting.
The new Shimano Di2 SuuntoPlus sports app connects your Suunto sports watch with Shimano’s electronic shifting for real-time guidance and saves data for after-ride analysis.
See the gears you are using and the status of your Di2 battery on your Suunto.
Through the Shimano Di2 SuuntoPlus sports app, developed in partnership with Shimano, you can monitor crucial data such as gear positions and Di2 battery status directly on your Suunto.
You can view details of your shifting after your ride in Suunto app.
The SuuntoPlus sports app also saves Shimano Di2 data in Suunto app for later analyzes. It can be viewed in relation to power and speed, for example.
What gear I am on (and why should I care)
Shimano Di2 SuuntoPlus sports app offers clear benefits both during and after the ride. During the ride, you will easily see how much battery you have left in your electronic shifting system and the gears you are on. The gears you use, are also saved as part of the activity in Suunto app. Taking a moment to study these, may give you some interesting insights.
Firstly, you will learn what gears you mostly use. Did you mostly use the higher or the lower gears or was the use well in balance? This can lead to two findings: is your gearing right for the terrain and how’s your chainline.
If you spend most of the time on the lower gears and hardly ever touch the higher ones, you may want to consider a smaller chainring. Or if you are a lot on the hardest gear and spinning out, a bigger chainring might be a good option.
Another consideration is the chainline. The word ‘chainline’ refers to how straight your chain runs between the front chainring(s) and the rear sprockets. A straigt chainline is more effective and stresses the components less. So, spending more time on rear sprockets that offer a straight, “perfect” chainline is smart. This data can be collected with the Shimano Di2 SuuntoPlus sports app.
How to use SHIMANO Di2 SuuntoPlus sports app
Sync the Shimano Di2 SuuntoPlus sports app to your watch from Suunto app’s SuuntoPlus Store.
Select the Shimano Di2 SuuntoPlus sports app in the exercise settings before starting your workout.
During activity, scroll with the middle button to view the SuuntoPlus screen.
Shimano Di2 SuuntoPlus sport apps stores data for after analysis in Suunto app.
Next time you start your ride with the same sport mode, your Shimano Di2 SuuntoPlus sports app is selected as default and connects with your Shimano Di2.
Happy riding!
Lead image: Philipp Reiter / The Adventure Bakery


View your e-bike data on your Suunto watch
Are you riding an e-bike with your Suunto? Now you can connect your watch with SHIMANO E-BIKE SYSTEMS bicycles. Learn how to do it!
Cycling is one of the key sports within the Suunto community, with enthusiasts leveraging Suunto's advanced GPS watches to monitor and optimize their performance and explore new terrain.
Suunto’s compatibility with SHIMANO E-BIKE SYSTEMS equipped e-bikes is a new addition to meet the diverse needs of cyclists. So, whether you are hitting the trails or commuting on a bike path on your e-bike, read on!
SHIMANO E-BIKE SYSTEMS SuuntoPlus sports app, a feature developed in collaboration with SHIMANO, shows you the assistant mode (Eco, Boost, Trail), power assistance level, e-bike battery status, speed and heart rate directly on your Suunto watch in real-time during your ride.
The sports app also stores that data for after-ride analysis: You can, for example, see the assistant percentage along with the other data you tracked with your Suunto watch in Suunto app.
How to use SHIMANO E-BIKE SYSTEMS SuuntoPlus sport app
Sync the SHIMANO E-BIKE SYSTEMS SuuntoPlus sports app to your watch from Suunto app’s SuuntoPlus Store.
Select the SHIMANO E-BIKE SYSTEMS SuuntoPlus sports app in the exercise settings before starting your workout.
During activity, scroll with the middle button to view the SuuntoPlus screen.
SHIMANO E-BIKE SYSTEMS SuuntoPlus sports app stores data for after analysis in Suunto app.
Next time you start your ride with the same sport mode, your SHIMANO E-BIKE SYSTEMS SuuntoPlus sports app is selected as default and connects with your SHIMANO E-BIKE SYSTEMS bicycle.
SuuntoPlus sports app is compatible with the SHIMANO E-BIKE SYSTEMS equipped with SHIMANO Wireless Units. SHIMANO Wireless Units can be equipped with following SHIMANO E-BIKE SYSTEMS Drive Unit Models:
EP801, EP6
EP800 / E6100/E6180/E5000/E5080
E7000
E8000 / E8080 (Only E6000 cannot be equipped for SHIMANO Wireless Units)


Italy dominates the Vertical Week 2024
Suunto World Vertical Week, the thrilling celebration of the uphill challenge, united outdoor enthusiasts from around the globe in a collective pursuit of elevation gain on March 18–24. All human-powered activities by the participants were counted and every hill was turned into an opportunity to conquer new heights.
We have now analyzed the data to see which country and activity type climbed the most!
The usual suspects were on top of the country rankings
In the country rankings, the usual suspects – countries in the mountainous regions of Europe – were once again on top. This time Italy dethroned Austria for the number one spot with over 400 meters of ascent per activity on average. Switzerland also broke its way to the top three.
The only non-European nation in the top 10 was South Africa in ninth place. Greece made it to the top 10 for the first time.
Average ascent meters by country
When looking at the total ascent, meaning adding up the ascent in all the activities in a nation for the Vertical Week, France took the top spot from Spain and Italy climbed past Austria on the third spot.
Top 10 for total ascent meters
France
Spain
Italy
Austria
Germany
Switzerland
USA
Poland
United Kingdom
Czech Republic
Skiers – and the Japanese trail runners – were above the rest
In the activity type rankings, there weren’t any major changes: ski touring activities had the biggest average ascent, followed by mountaineering and trail running. The average ascent for all the ski touring activities came close to the magical 1000-meter mark but was still a bit below the summit. Maybe next time!
Average ascent meters by activity type
While the skiers had the biggest days on average, when looking at individual activities with over 1000 meters of ascent, trail runners were in the lead. In 2023 the order was the other way round.
In the individual performances, four people really stood out: They all had tracked over 20.000 meters of human-powered ascent during the Vertical Week. Impressive!
And while looking at the big picture, many people seemed to push it more than last year: For a top 10% placing, you needed to climb 2275 meters during this year’s Vertical Week. That’s almost 373 meters more than in 2023.
The same change is visible in the top of the top: To make it to the top 3% of the Vertical Week participants, you needed to climb 4062 meters, 472 meters more than in 2023.
The country rankings winner Italy is very strong also in different activity type rankings. They earned a podium spot in six out of ten different categories!
Ski touring
Slovakia 1160m
Switzerland 1062m
Poland 1051m(Average for all countries 953 m)
Whoop whoop, we have a new winner in the ski touring category! The Slovakian skiers ascended more than any other nation in any of the categories. It’s also clear that the 1000-meter mark is a clear goal for skiers, and the entire top 3 broke that limit.
Trail running
Japan 1076m
Italy 674m
Greece 600m(Average for all countries 457 m)
This is amazing: The Japanese trail runners were the only ones breaking the 1000-meter mark in any other category than ski touring. They kept their well-deserved top spot in trail running for another year. Congratulations!
Mountaineering
Italy 865m
Finland 838m
France 799m(Average for all countries 633 m)
Italy continued their dominancy, but the second place was a surprise: How did such a flat country as Finland make its way to second place?
Mountain biking
South Africa 645m
Italy 547m
Slovenia 540m(Average for all countries 393 m)
The South Africans were active on the bike, climbed more than any other nation and ensured that also the African continent was presented in the rankings.
Gravel cycling
United Kingdom 656m
United States 440m
Italy 421m(Average for all countries 298 m)
Gravel cycling was a new addition on the list this time. And, not surprisingly, the ascent meters for gravel cycling fell somewhere between mountain biking and cycling. The UK took the top spot in the activity ranking clearly.
Cycling
Spain 435m
Italy 335m
Slovenia 286m(Average for all countries 210 m)
Everyone knows that cycling in Spain in the spring is great. And they seem to know it themselves, too!
Trekking
Japan 850m
Switzerland 575m
Austria 541m(Average for all countries 351 m)
The Japanese took the top spot in two categories, trekking and trail running. Two category wins was only matched by Italy (number one in mountaineering and hiking).
Hiking
Italy 438m
Slovakia 386m
Slovenia 351m(Average for all countries 240 m)
Yet another category with a strong Italian performance. Forza!
Nordic skiing
Switzerland 363m
Austria 324m
Norway 305m(Average for all countries 216 m)
While the top three countries in the cross country skiing category were expected, what was surprising was the change in the podium lineup from the previous year: None of these three were on the podium last year.
Running
Czech Republic 152m
Switzerland 138m
South Africa 130m(Average for all countries 95 m)
Running, the most popular Suunto activity in general, is not focused on the vert. Despite the smaller numbers, there still is a winner: Czech Republic took the number one spot!


